Research Article | | Peer-Reviewed

Multispectral and Hyperspectral Remote Sensing, from Image Processing to Visualisation Using ArcGIS Pro

Received: 24 January 2026     Accepted: 5 February 2026     Published: 27 June 2026
Views:       Downloads:
Abstract

In this scientific paper, the author provides a detailed analysis of using various Remote Sensing applications, from Image Processing to Visualisation using ArcGIS Pro (Included with Storytelling). The research paper has been formed during the last three years, during individual research and advocacy. To provide a summary, the authors travelled and represented in different kinds of tech conferences. The paper creates a value in the new space economy, by representing one of the latest tools used by researchers. However there are plenty of great GIS tools, the author used ArcGIS for this research. The purpose and significance of the study are relevant in today's geospatial challenges and accessibility of data usage, the research method made by individual decision, well detailed data analysis and image acquisition. The article can be a great start to engage the public audience and to understand the real work behind each space data image. The author warmly recommends the paper for every science interested person. General overview of the study area, 3 USG Landsat images, and one EO-1 Hyperion image, processing, extraction, and visualization using ArcGIS Pro. Our method used open source data for research, where we primarily examined the quality of the images, processing them as a single image rather than using large ML/AI-driven algorithms. We did not use a large dataset because our resources were not capable of handling that amount of data. However, the results can be derived from more accurate and detailed images based on the title, description, and agricultural solutions (in this case). In this study, we present and examine images from four different time points and created using different RGB methods.

Published in Earth Sciences (Volume 15, Issue 3)
DOI 10.11648/j.earth.20261503.13
Page(s) 158-162
Creative Commons

This is an Open Access article, distributed under the terms of the Creative Commons Attribution 4.0 International License (http://creativecommons.org/licenses/by/4.0/), which permits unrestricted use, distribution and reproduction in any medium or format, provided the original work is properly cited.

Copyright

Copyright © The Author(s), 2026. Published by Science Publishing Group

Keywords

Landsat, ArcGIS Pro, Earth Observation, Remote Sensing, Land Monitoring, Water Resource Management, LLDs (Landlocked Developing Countries)

1. Description
The following study has been started and generated, since 2023 by a self-employed researcher, who started her career in the geospatial industry. The main goal was to empower people from all walks of life into the work of a cartographer or geographer. It was also a goal set to finally provide more job opportunities for people working with nature and technology. During the 2 years of study, plenty of conferences and events have been attended, the main focus area in sensors, aerospace and research. By the help of satellite imagery, we provide more access to people with middle income regions, while online or offline, people have open access to these information and occupations.
Processing of satellite images is a long process, we have started to download, extract and use tools in GIS, for best quality of visualisation. Using space data needs a lot of patience and knowledge for creating unique imagery from raw data which could in the end be shown in an exhibition or fair for scientists or decision makers.
The area of the 4 imagery were selected randomly, or it was selected for the actual focus of the author.
1) Figure - Lake Poopó, Bolivia, Africa
2) Figure - Chile, South America
3) Figure - Guelb el Richat, Africa
4) Figure - Antarctica, Oceania
Figure 1. Bolivia, Africa .
Lake Poopó in Bolivia, Landsat 9, using ArcGIS pro software (for Personal Use) .
2. Sierra Gorda and Spence [11]
Our first image includes just part of the original imagery. The image clearly shows the lake surface and its vegetation, monstrous areas in the eastern part and flat in the western side. Ideal for NDVI calculation. .
By using the tool, we can access several other image use cases, Bolivia climate.
According to the article of the observation, the lake has disappeared as too much irrigation, caused by the El Nino phenomena. (The Conservation, 2016) Today, in 2025 we can see the lake in much better form, which shows evidence that water can be bringed back if society and government takes responsibility.
This kind of rehabilitation of nature in a dry climate like Bolivia, hot summers and chilly wonders by the mountain, makes hopes for many areas around the world.
Figure 2. Chile, South America .Sierra Gorda and Spence 2016 .
DHL, EnMAP imagery from EO-1 Hyperion 30m image resolution over Chilean mines. The Earth Observing-1 (EO-1) satellite was originally launched on November 21, 2000[17]
Source: https://www.usgs.gov/centers/eros/science/usgs-eros-archive-earth-observing-one-eo-1-hyperion
2.1. Lake Poopó, Bolivia
Our second imagery is in the Chile mine area, from 2016 by DLR German hyperspectral remote sensing satellite creator. German product used for historical data assessment and for testing purposes of visualisation of the ideal R G B band combination, using Esri platform.
Figure 3. Guelb el Richat, Africa. .
White backscatter shows interesting land on the imagery, darker color shows more rough areas and shadow effect.
The image also shows more homogeneous areas, where sand and dune shows smooth surface, behind the Google Earth map, as background image to the one token 9 years ago.
EO-1 Hyperion is an open source archive imagery, which is ideal for change detection and time change with other multispectral or hyperspectral imagery. Researchers and scientists can analyze land, ice, ocean or vegetation changes using the more than 200 bands, available as metadata.
2.2. Guelb el Richat, Africa
Another imagery, our 3rd one is placed in Africa, a natural phenomenon shows the unique land deformation around the mountain, with limited freshwater availability. Using pink, cyan, dark brown and white on the image shows good band combinations.
What do we know about Guelb el Richat and its surroundings?
It's a result of erosion over a million years of slow earth movement, More aerial and space imagery Source: https://www.wildmanlife.com/eye-of-the-sahara-geology-guelb-er-richat/ .
The geology structure of this momentum is mostly riolith and gabbro (https://en.wikipedia.org/wiki/Richat_Structure) located in the Sahara desert of Mauritania. .
Brown shows bedrock and pink shows the sand on this imagery, while blue could be the salty sedimentation. Dark pink the vegetation. For further studies Land cover change and change detection can be used for multiple image observation and analysis. .
Figure 4. Antarctica, Oceania. .
2.3. Antarctica and Oceania
Ocean science and the Antarctica
Our spot shows western side of Antarctica ice sheet, while moving slowly from inland to the ocean. The deep blue ocean and the terrain characteristics of the island can be clearly visible.
Thousands or even hundreds of thousands of small pieces of broken ice cubes travelling around the coast of the land area.
This sensor captured a great moment during winter time 2024 December. USG imagery shows the real magic of winter captured in a single imagery.
Little storytelling
There are 193 countries on our planet, with three oceans: the Atlantic, the Pacific, and the Indian Ocean. How many countries have access to the ocean, and how many do not? A little task for those who are curious).
Countries that do not have access to the ocean do not have economies closely linked to the deep sea, such as seafood, production, maritime or shipping jobs.
Landlocked countries now want to contribute to the global mapping industry, which is good, but also presents challenges. Ultimately, new experts in hydrology or water studies can showcase their talents, it should be open for all of us.
Satellite imagery is playing an increasingly important role, and only a few companies want to take the lead in the scientific world. It should be open for all of us.
It seems that geographers and GIS specialists have achieved the work and necessity required in the market. However, they can work for large corporations, smaller companies, or in some cases even independently. Individual scientific work is extremely challenging and has limited resources, but you have your own ideas that can eventually be defended and supported, while large companies rarely allow free research or support individual talent.
It is an exciting time to work in this field, whether you are in the field collecting samples and leaves, taking photographs, or taking 300 photographs with a drone. Fieldwork is done with cell phones or analyzing water quality, deep-sea cartographers travel the seas by boat, and educational or environmental agencies protect wildlife, to name a few.
Working in ocean exploration can also be a challenging area, which needs a lot of special skills, to handle different kinds of situations.
1) Navigations and orientations
Do you know where to go, without using any map or mobile.
2) Personal attitude, patience or attention to details
Even if you are a jobseeker, you need to keep yourself strong, as your work deserves to be paid, unpaid positions are not healthy and organisations need to support individuals especially in these jobs.
3) Cartography, mapping skills
How do you navigate yourself, do you ever use maps for orientations.
Nevertheless, if you are working in the field, it might never be boring if you like explorations, wild life, deep blue and analytical skills.
4) Gender equality and call to the United Nations
Women in the GIS field , or someone who has never lived close to sea or ocean, can be a super experience or work goal in life, if you have the chance to offer a chair for those who might have never seen the ocean before, and are eager to explore new things.
5) Making business from the ocean, equal access to ocean
If you had a startup before, have you ever been rejected by an investor? Sure you been.
Ocean research as a concept – what should every investor consider before shutting down negotiations with you? The ocean is not only dependent on and connected to the deep sea and its ecosystem, but also includes all water on and below the earth's surface, such as rivers, lakes, seas, and smaller ditches, the most important of which is groundwater.
Investors are not ocean scientists, their investments are often not public, and in many cases they hide the real transfer of power.
Nevertheless, they form the backbone of the industry and, as such, do not open the door to countries with limited access to the deep sea or the open ocean.
If you are an investor, this should be a signal for you to also support indigenous communities that have the talent, educational background, willingness to learn, and opportunities to try new areas of research-based or science-based exploration. When we talk about protecting the land and the ocean, people's access to clean water begins on land and ends in the ocean.
Even small sponsors of schools present a book about the ocean and corals to discover the invisible.
When students study hydrology or hydro-local studies, finding a job in this field is not their first priority, as the job market shows them a completely different path, which is of course not their fault.
You have to find out where to look for jobs where you can work with marine animals or exploration teams, which is very rare if you come from a small village or town where contact with the sea is limited.
If you really love helping others and have the opportunity to do so, support those who have no connection to this field but would like to learn more about it, and join the scientific community, where you can meet great people with whom you can find your place in the world and work towards a goal to enjoy life while doing what you love and working for others and for nature.
3. Method
The GIS method used the same for all the 4 imagery, as digital image interpretation. Download imagery from USG database, extract and visualize on ArcGIS pro. Using individual and random RGB bands, band compositions with zoom and adding a few special filters to sharpen the imagery, including in layers, title, descriptions, proper markers, signs. Most GIS users do not include where the image origin came from, was it processed by an individual or with a processor, ergo a machine without adding extra details to the imagery. Cartography is very important for satellite imager, downstream sector.
Spectral wavelength, spatial and spectral characteristics visualize the land surface. Band composition, using natural color, infrared, agriculture and other combinations.Described band combination for natural color, as reference.
4. Results
Our research result shows a diverse outcome, as processing the data one by one results in more quality and more detail than we would use AI based tools or code for multiple or hundreds of image processing. We used this method, as we believe working with one image at a time, shows the best result for our environmental research, climate impact. From a scientific perspective, it shows a better quality for the non-expert users, or non-EO experts.
Understanding the way of processing, repeating the same way can be overwhelming or slow. However if we want to create something unique, then we need to invest more time in each imagery.
Overall, the invested time and resources shows a great result, which can lead to an exhibition or GIS fair in the next few years or months. Never forget, Proactively bring a chair, even when it's not requested, and try to select your leaders and not vice versa. Expect numerous rejections as not everyone will support you.
Abbreviations

EO

Earth Observation

RS

Remote Sensing

GIS

Geospatial Information Systems

LLDCs

Landlocked Developing Countries

WiS

Women in Science

STEM

Science, Technology, Education, Mathematics

USG

US Geological Survey

EO-1

Earth Observing 1 (NASA Started in 2000)

NASA

National Aeronautics and Space Administration
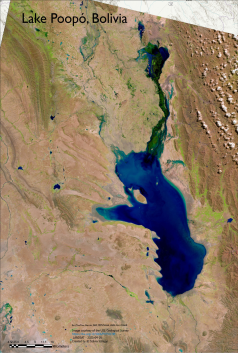
Author Contributions
Szilvia Szilagyi: Formal Analysis, Methodology, Project administration, Resources, Software, Visualization, Writing – original draft
Conflicts of Interest
The author declares no conflicts of interest.
References
[1] Juan Torres-Batlló, Belen Marti-Cardona The conservation, Why Bolivia's second largest lake disappeared and how to bring it back. January 11, 2021 5.36pm CET
[2] 
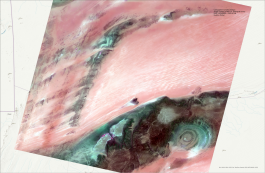
Giulio Aprin, 2026, The Eye of the sahara geology guelb er richat
[3] Richat Structure, wikipedia:
[4] Multispectral data source: Landsat data access:
[5] EO Portal, Earth Observing 1, 2023
[6] Hyperspectral data source: USGS EROS Archive - Earth Observing One (EO-1) - Hyperion
[7] Women Tech Network, What challenge women face in geospatial data careers and how can they overcome them, (unknown year)
[8] Ocean science in action, empowering women for a sustainable ocean future, 2023
[9] Landlocked country, (44 LL country): wikipedia
[10] Lake Popoo, 2025 Image creator: Szilvia Szilagyi 2025 April Using ESRI Personal user licence
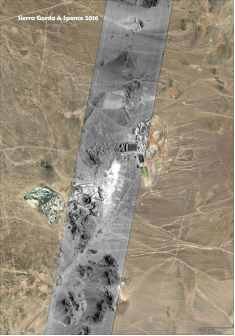
[11] Sierra Gorda and Spence 2016, Image creator: Szilvia Szilagyi 2024, Aug 9. Using ESRI Personal user licence.
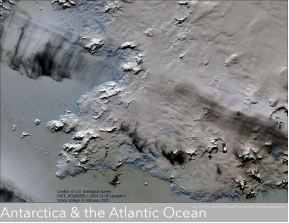
[12] Antarctica and Oceania, 2024, Image creator: Szilvia Szilagyi 2025. ESRI Personal user.
[13] Guelb er Richat 2025, Image creator Szilvia Szilagyi, using ESRI Personal licence user.
[14] Matt Collins, Geo Week, Younger Geospatial professionals discuss the next generation of industry insiders, 2023
[15] Climate Science Special Report: Fourth National Climate Assessment, Volume I, Personal Author(s): Wuebbles, Donald J.; Fahey, David W.; Hibbard, Kathy A. Corporate Authors(s): U.S. Global Change Research Program; National Oceanic and Atmospheric Administration; National Aeronuatics and Space Administration; 2017, Series: U.S. National Climate Assessment,
[16] D. P. Roy a, V. Kovalskyy a, H. K. Zhang a, E. F. Vermote b, L. Yan a, S. S. Kumar a, A. Egorov Remote sensing Environment, 2016, Characterization of Landsat-7 to Landsat-8 reflective wavelength and normalized difference vegetation index continuity,
[17] Earth Observing One (EO-1) - Hyperion Digital Object Identifier
[18] Land Cover Changes based on Landsat imagery, 2023
Cite This Article
  • APA Style

    Szilagyi, S. (2026). Multispectral and Hyperspectral Remote Sensing, from Image Processing to Visualisation Using ArcGIS Pro. Earth Sciences, 15(3), 158-162. https://doi.org/10.11648/j.earth.20261503.13

    Copy | Download

    ACS Style

    Szilagyi, S. Multispectral and Hyperspectral Remote Sensing, from Image Processing to Visualisation Using ArcGIS Pro. Earth Sci. 2026, 15(3), 158-162. doi: 10.11648/j.earth.20261503.13

    Copy | Download

    AMA Style

    Szilagyi S. Multispectral and Hyperspectral Remote Sensing, from Image Processing to Visualisation Using ArcGIS Pro. Earth Sci. 2026;15(3):158-162. doi: 10.11648/j.earth.20261503.13

    Copy | Download

  • @article{10.11648/j.earth.20261503.13,
      author = {Szilvia Szilagyi},
      title = {Multispectral and Hyperspectral Remote Sensing, from Image Processing to Visualisation Using ArcGIS Pro},
      journal = {Earth Sciences},
      volume = {15},
      number = {3},
      pages = {158-162},
      doi = {10.11648/j.earth.20261503.13},
      url = {https://doi.org/10.11648/j.earth.20261503.13},
      eprint = {https://article.sciencepublishinggroup.com/pdf/10.11648.j.earth.20261503.13},
      abstract = {In this scientific paper, the author provides a detailed analysis of using various Remote Sensing applications, from Image Processing to Visualisation using ArcGIS Pro (Included with Storytelling). The research paper has been formed during the last three years, during individual research and advocacy. To provide a summary, the authors travelled and represented in different kinds of tech conferences. The paper creates a value in the new space economy, by representing one of the latest tools used by researchers. However there are plenty of great GIS tools, the author used ArcGIS for this research. The purpose and significance of the study are relevant in today's geospatial challenges and accessibility of data usage, the research method made by individual decision, well detailed data analysis and image acquisition. The article can be a great start to engage the public audience and to understand the real work behind each space data image. The author warmly recommends the paper for every science interested person. General overview of the study area, 3 USG Landsat images, and one EO-1 Hyperion image, processing, extraction, and visualization using ArcGIS Pro. Our method used open source data for research, where we primarily examined the quality of the images, processing them as a single image rather than using large ML/AI-driven algorithms. We did not use a large dataset because our resources were not capable of handling that amount of data. However, the results can be derived from more accurate and detailed images based on the title, description, and agricultural solutions (in this case). In this study, we present and examine images from four different time points and created using different RGB methods.},
     year = {2026}
    }
    

    Copy | Download

  • TY  - JOUR
    T1  - Multispectral and Hyperspectral Remote Sensing, from Image Processing to Visualisation Using ArcGIS Pro
    AU  - Szilvia Szilagyi
    Y1  - 2026/06/27
    PY  - 2026
    N1  - https://doi.org/10.11648/j.earth.20261503.13
    DO  - 10.11648/j.earth.20261503.13
    T2  - Earth Sciences
    JF  - Earth Sciences
    JO  - Earth Sciences
    SP  - 158
    EP  - 162
    PB  - Science Publishing Group
    SN  - 2328-5982
    UR  - https://doi.org/10.11648/j.earth.20261503.13
    AB  - In this scientific paper, the author provides a detailed analysis of using various Remote Sensing applications, from Image Processing to Visualisation using ArcGIS Pro (Included with Storytelling). The research paper has been formed during the last three years, during individual research and advocacy. To provide a summary, the authors travelled and represented in different kinds of tech conferences. The paper creates a value in the new space economy, by representing one of the latest tools used by researchers. However there are plenty of great GIS tools, the author used ArcGIS for this research. The purpose and significance of the study are relevant in today's geospatial challenges and accessibility of data usage, the research method made by individual decision, well detailed data analysis and image acquisition. The article can be a great start to engage the public audience and to understand the real work behind each space data image. The author warmly recommends the paper for every science interested person. General overview of the study area, 3 USG Landsat images, and one EO-1 Hyperion image, processing, extraction, and visualization using ArcGIS Pro. Our method used open source data for research, where we primarily examined the quality of the images, processing them as a single image rather than using large ML/AI-driven algorithms. We did not use a large dataset because our resources were not capable of handling that amount of data. However, the results can be derived from more accurate and detailed images based on the title, description, and agricultural solutions (in this case). In this study, we present and examine images from four different time points and created using different RGB methods.
    VL  - 15
    IS  - 3
    ER  - 

    Copy | Download

Author Information
  • Independent Scholar, Warsaw, Poland

    Biography: Szilvia Szilagyi Early career ocean scientist, storyteller and geographer Previously 2x Founder wspace36 (previously Drone Design Lab, 2022GIS advocate for equal GIS consultancy) ERC participant in 2024.