Groundwater is one of the most crucial natural water supplies because of continuously directly or indirectly supports many domestic, agricultural, and industrial activities but is now being degraded due to various causes. Therefore, this study aimed to iddentfy and map the factors that determine groundwater potential and produce a groundwater potential zones map for Genale-Dawa Bale Sub-Basin. Accordingly, in this study, ten (10) factors affect groundwater potential at varying degrees namely: rainfall, geomorphology, LULC, lithology, soil texture, slope, elevation, topographic wetness index, drainage, and lineament density were used. Criteria weights and rankings were assigned based on expert opinion, literature review, and field survey experience, using Analytical Hierarchy Process (AHP) and ArcGIS 10.3 software to map potential groundwater zones. The results show that thematic factors such as rainfall, geomorphology, LULC, lithology, soil texture, slope, topographic wetness index, elevation, drainage density, and lineament density affect groundwater potential with weight values of 24.2%, 18.7%, 10.7%, 13%, 7.9%, 6.9%, 3.8%, 3.8%, 5.4%, and 5.7% respectively in the study area. Maps of groundwater potential zones classified into five categories: very low 366,001.80 ha (24.36%), low 249,151.07 ha (16.58%), moderate 271,817 ha (18.09%), high 278,343.13 ha (18.53%), and very high 337,194.06 ha (22.44%) for the Bale Zone and the Genale-Dawa Sub-Basin. The low to very low groundwater potentiality has been seen on the map at different distances due to the presence of hills and steep slopes, rock outcrop surfaces, clay soil textural class, low rainfall areas, very high drainage density, low lineament density, bare land are the main reasons. The validation analysis revealed a 91% confirms the very good agreement between the groundwater inventory data and the developed groundwater potential zone. The groundwater potential zones assessment and map of the current research results serve as a baseline information for planners, decision-makers, and adopters of sustainable management options, to identify suitable sites for groundwater exploration, and initial for further studies. Further studies, detailed water chemistry surveys, geophysical surveys at potential drilling sites, and grade analysis should recommended.
| Published in | Earth Sciences (Volume 13, Issue 5) |
| DOI | 10.11648/j.earth.20241305.12 |
| Page(s) | 193-218 |
| Creative Commons |
This is an Open Access article, distributed under the terms of the Creative Commons Attribution 4.0 International License (http://creativecommons.org/licenses/by/4.0/), which permits unrestricted use, distribution and reproduction in any medium or format, provided the original work is properly cited. |
| Copyright |
Copyright © The Author(s), 2024. Published by Science Publishing Group |
Remote Sensing (RS), MCDA (AHP) Genale-Dawa, Bale Zone, Groundwater Potential, Geospatial, Weight Overlay Analysis
Major soil types | Area (ha) | Area (%) |
|---|---|---|
Calcic Cambisols | 40384.50 | 2.67 |
Cambic Arenosols | 19319.31 | 1.28 |
Chromic Cambisols | 308859.70 | 20.45 |
Chromic Luvisols | 247737.91 | 16.40 |
Chromic Vertisols | 154710.08 | 10.24 |
Eutric Cambisols | 32764.98 | 2.17 |
Eutric Nitosols | 34432.52 | 2.28 |
Lithosols | 146606.24 | 9.71 |
Pellic Vertisols | 303248.92 | 20.08 |
Vertic Cambisols | 222254.22 | 14.72 |
Data collected | Sources | Resolution | Output layer |
|---|---|---|---|
Rainfall | Metrological Agency of Ethiopia, | 30 m | Rainfall Map |
Soil data | FAO and laboratory analysis | 30 m | Soil texture |
Geological Map | Geological survey of Ethiopia | 30 m | Geology map |
DEM | http://igskmncngs506.cr.usgs.gov/gmtd | 30 m | Drainage, slope |
Landsat8 | USGS | 30 m | Lineament |
Water inventory data | Regional and Zonal MoWIE | 30 m | validation map |
Landsat8 | USGS with path 166 having row 055, and 056, path 167 with row 055 and 056 and path 168 with row 055 | 30 m | LULC Map |
No. | Software used | Version | Description |
|---|---|---|---|
1 | ArcGIS | 10.3 | image preprocessing and thematic map generated |
2 | ERDAS | 15 | Image preprocessing, classification |
3 | IDRISI | 17.02 | weights Calculation |
4 | Google Earth | accuracy of the classification | |
5 | PCI Geomatica | 17 | lineament generated |
6 | GPS | Ground data collection |
Factors | Class | Rate | Rank | Factors | Class | Rate | Rank |
|---|---|---|---|---|---|---|---|
Rainfall (mm) | 374.6 - 940.7 | Very low | 1 | TWI | 2.08 -7.47 | Very low | 1 |
940.7–1090.8 | low | 2 | 7.47 – 9.36 | low | 2 | ||
1090.8–1281 | Moderate | 3 | 9.36 – 11.82 | Moderate | 3 | ||
281–1561.3 | High | 4 | 11.82 – 15.51 | High | 4 | ||
1561.3 –2236 | Very high | 5 | 15.52 – 26.27 | Very high | 5 | ||
Geomorphology | Volcanic landform | Very low | 1 | Elevations (m) | 670 - 1400 | Very high | 5 |
Structural landform | Low | 2 | 1400 - 1900 | High | 4 | ||
Residual landform | Moderate | 3 | 1900 - 2500 | Moderate | 3 | ||
Alluvial landform | High | 4 | 2500 - 3000 | low | 2 | ||
Flat or flood plain | Very high | 5 | 3000 - 4461 | Very low | 1 | ||
LULC | Others | Very low | 1 | Drainage density (km/km2) | 0 - 21 | Very high | 5 |
Built up | Low | 2 | 21 - 33 | High | 4 | ||
Water body | Moderate | 3 | 33 - 45 | Moderate | 3 | ||
Agricultural area | High | 4 | 45 - 58 | low | 2 | ||
Forest | Very High | 5 | 58 – 68.95 | Very low | 1 | ||
Lithology | Jurassic | Low | 2 | Lineament (km/km2) | 0 – 0.15 | Very low | 1 |
Cretaceous | High | 3 | 0.15 – 0.35 | Low | 2 | ||
Tartary | Moderate | 4 | 0.35 – 0.65 | Moderate | 3 | ||
Quaternary | Very high | 5 | 0.65 – 0.95 | High | 4 | ||
0.95 – 1.81 | Very high | 5 | |||||
Soil texture | Clay | Very low | 1 | Slope (degree) | 0- 4.5 | Very high | 5 |
Clay loam | Low | 2 | 4.5 - 10.4 | High | 4 | ||
Sandy clay loam | Moderate | 3 | 10.4 – 17.9 | Moderate | 3 | ||
Sandy loam | High | 4 | 17.9 – 27.7 | Low | 2 | ||
Sandy | Very High | 5 | 27.7 – 79.21 | Very low | 1 |
Intensity of relative important | Definition |
|---|---|
1 | Equal importance |
2 | Weak or slight |
3 | Moderate importance |
4 | Moderate Plus |
5 | strong importance |
6 | strong plus |
7 | Very strong |
8 | very very strong |
9 | Extremely importance |
Matrix size | 1 | 2 | 3 | 4 | 5 | 6 | 7 | 8 | 9 | 10 |
|---|---|---|---|---|---|---|---|---|---|---|
RI | 0 | 0 | 0.58 | 0.9 | 1.12 | 1.24 | 1.32 | 1.41 | 1.45 | 1.51 |
References | Spring and well yield in (l/s) and its standard classifications | ||||
|---|---|---|---|---|---|
Very low | Low | Moderate | High | Very high | |
Tuinhof et al. (2011) | < 0.1l/s | 0.1-0.5l/s | 2-5 l/s | 5-20l/s | >20l/s |
[15] | - | 0- 1 l/s | 1-5 l/s | >5 l/s | - |
[63] | - | <0.28 l/s | 0.28 – 5.8 l/s | 13.3 – 22.5 l/s | - |
Sapkota et al (20201) | - | 0.017 l/s | 0.017 – 0.17 l/s | >0.17 l/s | - |
Enideg (2012) | - | 0.05-0.5l/s | 2-5l/s | 5-20l/s | - |
Sogrea (2013). | - | 0-3l/s | 3-6l/s | 6-20l/s | >20l/s |
RF Class (mm) | Rates | Rank | Area (ha) | Area (%) |
|---|---|---|---|---|
374.6 - 940.7 | Very low | 1 | 233064.85 | 15.43 |
940.7–1090.8 | Low | 2 | 217454.12 | 14.50 |
1090.8–1281 | Moderate | 3 | 289588.83 | 19.17 |
281–1561.3 | High | 4 | 268512.45 | 17.78 |
1561.3 –2236 | Very high | 5 | 501738.16 | 33.22 |
Geomorphology Types | Rates | Rank | Area (ha) | Area (%) |
|---|---|---|---|---|
Volcanic landform | Very low | 1 | 509125.22 | 33.71 |
Structural landform | low | 2 | 20862.12 | 1.38 |
Residual landform | Moderate | 3 | 523800.97 | 34.68 |
Alluvial landform | High | 4 | 3769.21 | 0.25 |
Flat or flood plain | Very high | 5 | 452666.57 | 29.97 |
LULC Types | Rates | Rank | Area (ha) | Area (%) |
|---|---|---|---|---|
Urban | Very low | 1 | 36090.42 | 1.90 |
Others land | Low | 2 | 860770.74 | 45.39 |
Open water sources | Moderate | 3 | 37392.54 | 1.97 |
Cultivated land | High | 4 | 772202.57 | 40.72 |
Forest Land | Very high | 5 | 190081.42 | 10.02 |
Lithological Codes | Age | Rates | Ranks | Area (ha) | Area (%) |
|---|---|---|---|---|---|
Jg1 | Jurassic | Low | 2 | 102656.76 | 6.80 |
Jg2 | 315761.80 | 20.91 | |||
Jh | 19555.05 | 1.29 | |||
Ju | 123083.80 | 8.15 | |||
458400.65 | 37.15 | ||||
Ncb | Tartary | Moderate | 4 | 83443.03 | 5.52 |
P2a | 100233.97 | 6.64 | |||
PNab | 135692.51 | 8.98 | |||
PNmb | 104229.46 | 6.90 | |||
423598.97 | 28.04 | ||||
Kg1 | Cretaceous | High | 3 | 34005.71 | 2.25 |
Qb | Quaternary | Very high | 5 | 89825.93 | 5.95 |
Qb1 | 135723.90 | 8.99 | |||
Qg | 266214.39 | 17.63 | |||
491764.22 | 32.56 | ||||
Textural Class | Rates | Rank | Area (ha) | Area (%) |
|---|---|---|---|---|
Clay | Very low | 1 | 199130.94 | 13.18 |
Clay loam | Low | 2 | 331948.27 | 21.98 |
Loam | Moderate | 3 | 509785.98 | 33.75 |
Sand clay | High | 4 | 430029.71 | 28.47 |
Sand clay loam | Very high | 5 | 39627.90 | 2.62 |
Slope Class | Rates | Rank | Area (ha) | Area (%) |
|---|---|---|---|---|
0 - 4.5 | Very high | 5 | 841640.30 | 55.74 |
4.5 - 10.4 | High | 4 | 360055.89 | 23.84 |
10.4 - 17.9 | Moderate | 3 | 175206.88 | 11.60 |
17.9 - 27.7 | Low | 2 | 92649.50 | 6.14 |
27.7 – 79.21 | Very low | 1 | 40502.30 | 2.68 |
TWI Class | Rates | Rank | Area (ha) | Area (%) |
|---|---|---|---|---|
2.08 - 7.47 | Very low | 1 | 874482.26 | 57.91 |
7.47 - 9.36 | Low | 2 | 352792.44 | 23.36 |
9.36 - 11.82 | Moderate | 3 | 153641.43 | 10.17 |
11.82 - 15.51 | High | 4 | 107710.71 | 7.13 |
15.1 - 26.37 | Very high | 5 | 21433.35 | 1.42 |
Elevation Class | Rates | Rank | Area (ha) | Area (%) |
|---|---|---|---|---|
670 - 1400 | Very high | 5 | 561682.90 | 37.20 |
1400 - 1900 | High | 4 | 344831.94 | 22.84 |
1900- 2500 | Moderate | 3 | 332258.60 | 22.00 |
2500 - 3000 | Low | 2 | 134750.30 | 8.92 |
3000 - 4463 | Very low | 1 | 136529.59 | 9.04 |
Drainage Density Class (km/km2) | Rates | Rank | Area (ha) | Area (%) |
|---|---|---|---|---|
0- 21 | Very high | 5 | 1561.05 | 0.10 |
21 – 33 | High | 4 | 42347.7 | 2.80 |
33 -45 | Moderate | 3 | 83267.55 | 5.51 |
45- 58 | Low | 2 | 1071437.85 | 70.96 |
58 -68.85 | Very low | 1 | 311249.07 | 20.61 |
Lineament Density Class (km/km2) | Rates | Rank | Area (ha) | Area (%) |
|---|---|---|---|---|
0 - 0.15 | Very low | 1 | 385452.07 | 25.52 |
0.15 - 0.35 | Low | 2 | 408769.84 | 27.06 |
0.35 - 0.65 | Moderate | 3 | 375241.06 | 24.84 |
0.65 - 0.95 | High | 4 | 247493.88 | 16.39 |
0.95 - 1.81 | Very high | 5 | 93474.93 | 6.19 |
Parameters | RF | Gm | LULC | Glg | ST | SL | TWI | El | DD | LD |
|---|---|---|---|---|---|---|---|---|---|---|
RF | 1 | 2 | 4 | 3 | 4 | 4 | 3 | 4 | 4 | 3 |
Gm | 1/2 | 1 | 4 | 2 | 2 | 4 | 4 | 5 | 3 | 3 |
LULC | 1/4 | ¼ | 1 | 1 | 1 | 2 | 4 | 3 | 3 | 3 |
Glg | 1/3 | ½ | 1 | 1 | 2 | 3 | 3 | 5 | 3 | 3 |
ST | 1/4 | ½ | 1 | 1/2 | 1 | 2 | 2 | 2 | 1 | 2 |
SL | 1/4 | ¼ | ½ | 1/3 | 1/2 | 1 | 2 | 2 | 1 | 2 |
TWI | 1/3 | ¼ | ¼ | 1/3 | 1/2 | 1/2 | 1 | 1/2 | 3 | 2 |
EL | 1/4 | 1/5 | 1/3 | 1/5 | 1/2 | 1/2 | 2 | 1 | 1/3 | 1/2 |
DD | 1/4 | 1/3 | 1/3 | 1/3 | 1 | 1/3 | 1 | 3 | 1 | 1 |
LD | 1/3 | 1/3 | 1/3 | 1/3 | 1/2 | 1/2 | 3 | 2 | 1 | 1 |
Total | 3.75 | 5.62 | 12.75 | 9.03 | 13.00 | 17.83 | 25.00 | 27.50 | 20.33 | 18.83 |
Factors | RF | Gm | LULC | lith | ST | SL | TWI | EL | DD | LD | Eigen-values (weights) | Weight (%) | Consistancy |
|---|---|---|---|---|---|---|---|---|---|---|---|---|---|
RF | 0.267 | 0.356 | 0.314 | 0.332 | 0.308 | 0.224 | 0.120 | 0.145 | 0.197 | 0.159 | 0.242 | 24.2 | 0.908 |
Gm | 0.133 | 0.178 | 0.314 | 0.221 | 0.154 | 0.224 | 0.160 | 0.182 | 0.148 | 0.159 | 0.187 | 18.7 | 1.052 |
LULC | 0.067 | 0.045 | 0.078 | 0.111 | 0.077 | 0.112 | 0.160 | 0.109 | 0.148 | 0.159 | 0.107 | 10.7 | 1.358 |
Lith | 0.089 | 0.089 | 0.078 | 0.111 | 0.154 | 0.168 | 0.120 | 0.182 | 0.148 | 0.159 | 0.13 | 13 | 1.172 |
ST | 0.067 | 0.089 | 0.078 | 0.055 | 0.077 | 0.112 | 0.080 | 0.073 | 0.049 | 0.106 | 0.079 | 7.9 | 1.023 |
SL | 0.067 | 0.045 | 0.039 | 0.037 | 0.038 | 0.056 | 0.080 | 0.073 | 0.148 | 0.106 | 0.069 | 6.9 | 1.227 |
TWI | 0.089 | 0.045 | 0.020 | 0.037 | 0.038 | 0.028 | 0.040 | 0.018 | 0.049 | 0.018 | 0.038 | 3.8 | 0.954 |
EL | 0.067 | 0.036 | 0.026 | 0.022 | 0.038 | 0.028 | 0.080 | 0.036 | 0.016 | 0.027 | 0.038 | 3.8 | 1.035 |
DD | 0.067 | 0.059 | 0.026 | 0.037 | 0.077 | 0.019 | 0.040 | 0.109 | 0.049 | 0.053 | 0.054 | 5.4 | 1.090 |
LD | 0.089 | 0.059 | 0.026 | 0.037 | 0.038 | 0.028 | 0.120 | 0.073 | 0.049 | 0.053 | 0.057 | 5.7 | 1.079 |
Total | 1 | 1 | 1 | 1 | 1 | 1 | 1 | 1 | 1 | 1 | 1 | 100 |
Groundwater Potential Class | Area (ha) | Area (%) |
|---|---|---|
Very low | 249151.07 | 16.58 |
Low | 366001.80 | 24.36 |
Moderate | 271817.69 | 18.09 |
High | 278347.13 | 18.53 |
Very High | 337194.06 | 22.44 |
GWPZ rate | Well yield (l/s) | No. Well yield | No. Well yield | Validated (%) |
|---|---|---|---|---|
Very low | < 0.1 | 20 | 18 | 90.00 |
Low | 0.1 – 0.5 | 20 | 19 | 95.00 |
Moderate | 2 - 5 | 20 | 17 | 85.00 |
High | 5 - 20 | 20 | 18 | 90.00 |
Very High | >20 | 20 | 19 | 95.00 |
Total/Overall percentage | 100 | 91 | 91.00 | |
AHP | Analyitical Heriarical Process |
GIS | Geogrphical Information System |
MCDA | Multi Cerateria Decision Analysis |
| [1] | Abdessamed Derdour, Yacine Benkaddour, Brahim Bendahou. 2022. Application of remote sensing and GIS to assess groundwater potential in the transboundary watershed of the Chott El Gharbi (Algerian-Moroccan border). Applied Water Science 12(6): 1-17. |
| [2] | Abebe Debele Tolche, 2021. Groundwater potential mapping using geospatial techniques: a case study of Dhungeta-Ramis sub-basin, Ethiopia. Geology, Ecology, and Landscapes, 5(1), 65-80. |
| [3] | Adewumi, A. J. and Anifowose, Y. B. 2017. Hydrogeologic characterization of Owo and its environs using remote sensing and GIS. Applied Water Science, 7, 2987-3000. |
| [4] | Agarwal, R. and Garg, P. K., 2016. Remote sensing and GIS based groundwater potential and recharge zones mapping using multi-criteria decision making technique. Water resources management, 30(1), 243-260. |
| [5] | Ahmad, I., Dar, M. A., Andualem, T. G. and Teka, A. H., 2020. GIS-based multi-criteria evaluation of groundwater potential of the Beshilo River basin, Ethiopia. Journal of African earth sciences, 164: 103747. |
| [6] | Ahmed, S. A. 2016. Geospatial technology for delineating groundwater potential zones in Doddahalla watershed of Chitradurga district, India. The Egyptian Journal of RemoteSensing and Space Sciences, 19(2), 223–234. |
| [7] | Ajay Kumar V., Mondal N. C. and Ahmed S., 2020. Identification of groundwater potential zones using RS, GIS, and AHP techniques: a case study in a part of Deccan volcanic province (DVP), Maharashtra, India. Journal of the Indian Society of Remote Sensing, 48, 497-511. |
| [8] | Allafta, H., Opp, C. and Patra, S., 2020. Identification of groundwater potential zones using remote sensing and GIS techniques: A case study of the Shatt Al-Arab Basin. Remote Sensing, 13(1): 112. |
| [9] | Andualem, T. G. and Demeke, G. G. 2019. Groundwater potential assessment using GIS and remote sensing: A case study of Guna tana landscape, upper blue Nile Basin, Ethiopia. Journal of Hydrology: Regional Studies, 24: 100610. |
| [10] | Anteneh, Z. L., Alemu, M. M., Bawoke, G. T., Kehali, A. T., Fenta, M. C. and Desta, M. T., 2022. Appraising groundwater potential zones using geospatial and multi-criteria decision analysis (MCDA) techniques in Andasa-Tul watershed, Upper Blue Nile basin, Ethiopia. Environmental Earth Sciences, 81(1): 1-20. |
| [11] | Arulbalaji, P., Padmalal, D. and Sreelash, K. 2019. GIS and AHP techniques based delineation of groundwater potential zones: a case study from southern Western Ghats, India. Scientific reports, 9(1), 1-17. |
| [12] | Balamurugan, G., Seshan, K. and Bera, S. 2017. Frequency ratio model for groundwater potential mapping and its sustainable management in cold desert, India. Jour. King Saud University - Science, 29(3), 333–347. |
| [13] | Bane Lammesa Banti. 2017. Groundwater Potential and Recharge Zone Mapping by Using GIS and Remote Sensing Techniques in the Case of Middle Awash River Basins, Ethiopia (Doctoral dissertation, Addis Ababa University). |
| [14] | Benjmel, K.; Amraoui, F.; Boutaleb, S.; Ouchchen, M.; Tahiri, A.; Touab, A. 2020. Mapping of Groundwater Potential Zones in Crystalline Terrain Using Remote Sensing, GIS Techniques, and Multicriteria Data Analysis (Case of the Ighrem Region, Western Anti-Atlas, Morocco). Water, 12: 471. |
| [15] | Berhanu, K. G. and Hatiye, S. D., 2020. Identification of groundwater potential zones using proxy data: Case study of Megech watershed, Ethiopia. Journal of Hydrology: Regional Studies, 28: 100676. |
| [16] | Bhunia, G. S., 2020. An approach to demarcate groundwater recharges potential zone using geospatial technology. Applied Water Science, 10(6): 1-12. |
| [17] | Bouyoucos, G. J., 1962. Hydrometer method improved for making particle size analyses of soils 1. Agronomy journal, 54(5), 464-465. |
| [18] | Çelik, R. 2019. Evaluation of Groundwater Potential by GIS-Based Multicriteria Decision Making as a Spatial Prediction Tool: Case Study in the Tigris River Batman-Hasankeyf Sub-Basin, Turkey. Water, 11: 2630. |
| [19] | Chakrabortty, R.; Pal, S. C.; Malik, S.; Das, B. 2018. Modeling and mapping of groundwater potentiality zones using AHP and GIS technique: a case study of Raniganj Block, Paschim Bardhaman, West Bengal. Model. Earth Syst. Environ. 4, 1085–1110. |
| [20] | Chen, W., Panahi, M., Khosravi, K., Pourghasemi, H. R., Rezaie, F. and Parvinnezhad, D., 2019. Spatial prediction of groundwater potentiality using ANFIS ensembled with teaching-learning-based and biogeography-based optimization. Journal of Hydrology, 572, 435-448. |
| [21] | Chisadza, B., Mashakani, B. L., Gwate, O., Chiwara, P., Choruma, D. and Gumindoga, W. 2022. Determination of groundwater potential zones using geographic information systems and remote sensing in Lupane District, Zimbabwe. Irrigation and Drainage, 71(5), 1319-1331. |
| [22] | Choi W, Galasinski U, Cho S J and Hwang C S. 2012. A spatiotemporal analysis of groundwater level changes in relation to urban growth and groundwater recharge potential for Waukesha County, Wisconsin; Geographical Analysis, 44, 219–234. |
| [23] | Das B. and Pal S. C. 2019. Combination of GIS and fuzzy-AHP for delineating groundwater recharge potential zones in the critical Goghat-II block of West Bengal, India. Hydro Research, 2: 21-30. |
| [24] | Das, N. and Mukhopadhyay, S., 2020. Application of multi-criteria decision making technique for the assessment of groundwater potential zones: a study on Birbhum district, West Bengal, India. Environment, Development and Sustainability, 22, 931-955. |
| [25] | Das, S., Gupta, A., and Ghosh, S. 2017. Exploring potential groundwater recharge zones using MIF technique in semi-arid region: A case study of Hingoli district. Maharashtra. Spat. Information Resource, 25(6), 749–756. |
| [26] | Davoodi, M., D., Rezaei, M., Pourghasemi, H. R., Pourtaghie, Z. S., and Pradhan, B., 2015. Groundwater spring potential mapping using bivariate statistical model and GIS in the taleghan watershed Iran. Arabian Journal of Geosciences, 8(2): 913-929. |
| [27] | Doke, A. B., Zolekar, R. B., Patel, H. and Das, S. 2021. Geospatial mapping of groundwater potential zones using multi-criteria decision-making AHP approach in a hardrock basaltic terrain in India. Ecological Indicators, 127: 107685. |
| [28] | Elbeih, S. F. 2015. An overview of integrated remote sensing and GIS for groundwater mapping in Egypt. Ain Shams Engineering Journal, 6(1): 1-15. |
| [29] | Elewa H. H., Zelenakova M. and Nosair, A. M. 2021. Integration of the analytical hierarchy process and GIS spatial distribution model to determine the possibility of runoff water harvesting in dry regions: Wadi Watir in Sinai as a case study. Water, 13(6), 804. |
| [30] | Etikala, B.; Golla, V.; Li, P.; Renati, S. 2019. Deciphering groundwater potential zones using MIF technique and GIS: A study from Tirupati area, Chittoor District, Andhra Pradesh, India. Hydro Research, 1, 1–7. |
| [31] | FAO. 1998. World reference base for soil resources. World Soil Resour Rep 84: 21–22. |
| [32] | Fatema, K., Joy, M. A. R., Amin, F. R. and Sarkar, S. K. 2023. Groundwater potential mapping in Jashore, Bangladesh. Heliyon, 9(3). |
| [33] | Fauzia, L. Surinaidu, Abdur Rahman and Shakeel Ahmed. 2021. Distributed groundwater recharge potentials assessment based on GIS model and its dynamics in the crystalline rocks of South India. Scientific Reports, 11: 11772. |
| [34] | Fienen, M. N. and Arshad, M., 2016. The International Scale of the Groundwater Issue. In: Jakeman A. J., Barreteau O., Hunt R. J., Rinaudo JD., Ross A. (eds) Integrated Groundwater Management. Springer, Cham, 21-48. |
| [35] | Forkuor G, Pavelic P, Asare E and Obuobie E. 2013. Modelling potential areas of groundwater development for agriculture in northern Ghana using GIS/RS; Hydrol. Sci. J. 58 437–451. |
| [36] | Gnanachandrasamy, G., Zhou, Y., Bagyaraj, M., Venkatramanan, S., Ramkumar, T. and Wang, S. 2018. Remote sensing and GIS based groundwater potential zone mapping in Ariyalur District, Tamil Nadu. Journal of the Geological Society of India, 92(4): 484-490. |
| [37] | Golla, V., Etikala, B., Veeranjaneyulu, A., Subbarao, M., Surekha, A. and Narasimhlu, K. 2018. Data sets on delineation of groundwater potential zones identified by geospatial tool in Gudur area, Nellore district, Andhra Pradesh, India. Data in brief, 20: 1984-1991. |
| [38] | Guduru, J. U. and Jilo, N. B. 2022. Groundwater potential zone assessment using integrated analytical hierarchy process-geospatial driven in a GIS environment in Gobele watershed, Wabe Shebele river basin, Ethiopia. Journal of Hydrology: Regional Studies, 44, 101218. |
| [39] | Habtamu Deribe and Dereje Biru Debalke. 2021. Identification of Ground Water Potential Zones Using GIS and Remote Sensing Techniques in the Case of Odiyo Watershed, Ethiopia. Research Square |
| [40] | Hamza Abrarb, Abiyot Legesse Kuraa, Engida Esayas Dubea and Dereje Likisa Beyene. 2021. AHP based analysis of groundwater potential in the western escarpment of the Ethiopian rift valley. Geology, Ecology, and Landscapes, 7(3), 175-188. |
| [41] | Hirko, A., Mergia, G., Nigussie, A. and Dandesa, T., 2021. Seasonal and annual meteorological drought frequency: case study east hararge province (zone). Int. J. Res. Environ. Sci, 7, 1-10. |
| [42] | Hsin-Fu Yeh, Hung-I Lin, Shing-Tsz Lee, Min-Hsiang Chang, Kuo-Chin Hsu and Cheng-Haw Lee. 2014. GIS and SBF for estimating groundwater recharge of a mountainous basin in the Wu River watershed, Taiwan. Journal of Earth System Science, 123(3): 503-516. |
| [43] | Ibrahim-Bathis, K. and Ahmed, S. A., 2016. Geospatial technology for delineating groundwater potential zones in Doddahalla watershed of Chitradurga district, India. The Egyptian Journal of Remote Sensing and Space Science, 19(2), 223-234. |
| [44] | Ilugbo S. O., Adewoye O. E., Aladeboyeje A. I., Magawata U. Z., Oyedele A. A., Alabi T. O., Owolabi D. T., Adeleke K. A. and Adebayo S. O. 2020. Modeling of groundwater potential using remotely sensed data within Akure metropolis, Ondo State, Southwestern Nigeria. AppliedJournal of Physical Science, 2(3), 38-54. |
| [45] | Jang C S, Chen S K and Kuo Y M. 2013. Applying indicator based geostatistical approaches to determine potential zones of groundwater recharge based on borehole data; Catena 101: 178–187. |
| [46] | Jignasha Patel. 2021. Delineation of Groundwater Potential Zones in Rajkot Tehsil, Gujarat, Using Remote Sensing and GIS Techniques. International Journal of Environment and Geoinformatics, 8(3), 276-282. |
| [47] | Julla Kabeto, Dereje Adeba, Motuma Shiferaw Regasa and Megersa Kebede Leta. 2022. Groundwater Potential Assessment Using GIS and Remote Sensing Techniques: Case Study of West Arsi Zone, Ethiopia. Water, 14, 1838. |
| [48] | Kaewdum, N. and Chotpantarat, S., 2021. Mapping potential zones for groundwater recharge using a GIS technique in the lower Khwae Hanuman Sub-Basin Area, Prachin Buri Province, Thailand. Frontiers in Earth Science, 9, 717313. |
| [49] | Kamal Ku. Barik, Dalai P. C., Goudo S. P., Panda S. R., Nandi D. 2017. Delineation of groundwater potential zone in Baliguda Block of Kandhamal District, Odisha using geospatial technology approach. International Journal of Advanced Remote Sensing and GIS, 6(3), 2068-2079. |
| [50] | Kanagaraj, G., Suganthi, S., Elango, L. and Magesh, N. S., 2019. Assessment of groundwater potential zones in Vellore district, Tamil Nadu, India using geospatial techniques. Earth Science Informatics, 12(2): 211-223. |
| [51] | Kumari, S., Poddar, A., Kumar, N. and Shankar, V., 2022. Delineation of groundwater recharge potential zones using the modeling based on remote sensing, GIS and MIF techniques: a study of Hamirpur District, Himachal Pradesh, India. Modeling Earth Systems and Environment, 8(2), 1759-1770. |
| [52] | Lammesa, Bane Banti. 2017. Groundwater Potential and Recharge Zone Mapping by Using GIS and Remote Sensing Techniques in the Case of Middle Awash River Basins, Ethiopia (Doctoral dissertation, Addis Ababa University). |
| [53] | Lentswe, G. B. and Molwalefhe, L., 2020. Delineation of potential groundwater recharge zones using analytic hierarchy process-guided GIS in the semi-arid Motloutse watershed, eastern Botswana. Journal of Hydrology: Regional Studies, 28, 100674. |
| [54] | Machiwal, D., Jha, M. K. and Mal, B. C., 2011. Assessment of groundwater potential in a semi-arid region of India using remote sensing, GIS and MCDM techniques. Water resources management, 25, 1359-1386. |
| [55] | Magesh, N. S., Chandrasekar, N. and Soundranayagam, J. P., 2012. Delineation of groundwater potential zones in Theni district, Tamil Nadu, using remote sensing, GIS and MIF techniques. Geoscience frontiers, 3(2), 189-196. |
| [56] | Mahalingam, B. and Vinay, M., 2015. Identification of ground water potential zones using GIS and Remote Sensing Techniques: A case study of Mysore taluk-Karnataka. International journal of Geomatics and Geosciences, 5(3), 393-403. |
| [57] | Malczewski, J. 1999. GIS and multicriteria decision analysis. John Wiley and Sons. |
| [58] | Mallick, J., Khan, R. A., Ahmed, M., Alqadhi, S. D., Alsubih, M., Falqi, I. and Hasan, M. A., 2019. Modeling groundwater potential zone in a semi-arid region of Aseer using fuzzy-AHP and geoinformation techniques. Water, 11(12): 2656. |
| [59] | Mohammadi-Behzad, H. R., Charchi, A., Kalantari, N., Nejad, A. M. and Vardanjani, H. K., 2019. Delineation of groundwater potential zones using remote sensing (RS), geographical information system (GIS) and analytic hierarchy process (AHP) techniques: a case study in the Leylia–Keynow watershed, southwest of Iran. Carbonates and Evaporites, 34, 1307-1319. |
| [60] | Mojtaba Dolat Kordestani, Seyed Amir Naghibi, Hossein Hashemi, Kourosh Ahmadi, Bahareh Kalantar and Biswajeet Pradhan. 2019. Groundwater potential mapping using a novel data-mining ensemble model. Hydrogeology journal, 27(1), 211-224. |
| [61] | Muhammad Jamal Nasir, Sajjad Khan, Tehreem Ayaz, Amir Zeb Khan, Waqas Ahmad and Ming Lei. 2021. An integrated geospatial multi-influencing factor approach to delineate and identify groundwater potential zones in Kabul Province, Afghanistan. Environmental Earth Sciences, 80(13), 1-13. |
| [62] | Mukherjee, P., Singh, C. K. and Mukherjee, S., 2012. Delineation of groundwater potential zones in arid region of India a remote sensing and GIS approach. Water resources management, 26(9): 2643-2672. |
| [63] | Murmu, P., Kumar, M., Lal, D., Sonker, I. and Singh, S. K., 2019. Delineation of groundwater potential zones using geospatial techniques and analytical hierarchy process in Dumka district, Jharkhand, India. Groundwater for Sustainable Development, 9, 100239. |
| [64] | Naghibi, S. A., Moghaddam, D. D., Kalantar, B., Pradhan, B. and Kisi, O., 2017. A comparative assessment of GIS-based data mining models and a novel ensemble model in groundwater well potential mapping. Journal of Hydrology, 548: 471-483. |
| [65] | Nasir, M. J., Khan, S., Ayaz, T., Khan, A. Z., Ahmad, W. and Lei, M., 2021. An integrated geospatial multi-influencing factor approach to delineate and identify groundwater potential zones in Kabul Province, Afghanistan. Environmental Earth Sciences, 80(13): 1-13. |
| [66] | Nebiyou Kassahunand Mebruk Mohamed. 2018. Groundwater Potential Assessment and Characterization of Genale-Dawa River Basin. Open Journal of Modern Hydrology, 8, 126-144. |
| [67] | Panahi, M. R., Mousavi, S. M. and Rahimzadegan, M., 2017. Delineation of groundwater potential zones using remote sensing, GIS, and AHP technique in Tehran–Karaj plain, Iran. Environmental earth sciences, 76, 1-15. |
| [68] | Pathak, D. 2017. Delineation of groundwater potential zone in the Indo-gangetic plain through GIS analysis. Journal of Institute of Science and Technology, 22(1), 104-109. |
| [69] | Patle Deepak and Awasthi M. K. 2019. Groundwater Potential Zoning in Tikamgarh District of Bundelkhand Using Remote Sensing and GIS. International Journal of Agriculture, Environment and Biotechnology, 12(4): 311-318. |
| [70] | Pinto, D., Shrestha, S., Babel, M. S. and Ninsawat, S. 2017. Delineation of groundwater potential zones in the Comoro watershed, Timor Leste using GIS, remote sensing and analytic hierarchy process (AHP) technique. Applied Water Science, 7(1): 503-519. |
| [71] | Qadir, J., Bhat, M. S., Alam, A. and Rashid, I. 2020. Mapping groundwater potential zones using remote sensing and GIS approach in Jammu Himalaya, Jammu and Kashmir. GeoJournal, 85(2): 487-504. |
| [72] | Rahmati, O., Nazari Samani, A., Mahdavi, M., Pourghasemi, H. R. and Zeinivand, H., 2015. Groundwater potential mapping at Kurdistan region of Iran using analytic hierarchy process and GIS. Arabian Journal of Geosciences, 8, 7059-7071. |
| [73] | Rajasekhar, M.; Sudarsana Raju, G.; Sreenivasulu, Y.; Siddi Raju, R. 2019. Delineation of groundwater potential zones in semi-arid region of Jilledubanderu river basin, Anantapur District, Andhra Pradesh, India using fuzzy logic, AHP and integrated fuzzy-AHP approaches. Hydro Research, 2, 97–108. |
| [74] | Rajaveni, S. P., Brindha, K. and Elango, L., 2017. Geological and geomorphological controls on groundwater occurrence in a hard rock region. Applied water science, 7, 1377-1389. |
| [75] | Rajesh, J., Pande, C. B., Kadam, S. A., Gorantiwar, S. D. and Shinde, M. G., 2021. Exploration of groundwater potential zones using analytical hierarchical process (AHP) approach in the Godavari river basin of Maharashtra in India. Applied Water Science, 11(12), 182. |
| [76] | Raju, R. S., Raju, G. S. and Rajasekhar, M. 2019. Identification of groundwater potential zones in Mandavi River basin, Andhra Pradesh, India using remote sensing, GIS and MIF techniques. HydroResearch, 2: 1-11. |
| [77] | Rana, S., Deoli, V. and Chavan, S. R., 2022. Detection of abrupt change in trends of rainfall and rainy day’s pattern of Uttarakhand. Arabian Journal of Geosciences, 15(7), 618. |
| [78] | Raviraj, A., Kuruppath, N. and Kannan, B. 2017. Identification of potential groundwater recharge zones using remote sensing and geographical information system in Amaravathy basin. Journal of Remote Sens GIS, 6(4): 1-10. |
| [79] | Rukundo E. and Doğan A., 2019. Dominant influencing factors of groundwater recharge spatial patterns in Ergene river catchment, Turkey. Water, 11(4), 653. |
| [80] | Saaty T. 1980. The analytic hierarchy process: Planning, priority setting, resource allocation. McGraw-Hill, New York. |
| [81] | Sajad Ahmad Mir, M. S. Bhat, G. M. Rather, Durdanah Mattoo. 2021. Groundwater Potential Zonation using Integration of Remote Sensing and AHP/ANP Approach in North Kashmir, Western Himalaya, India. Remote Sensing of Land, 5(1): 41-58. |
| [82] | Sapkota, S., Pandey, V. P., Bhattarai, U., Panday, S., Shrestha, S. R. and Maharjan, S. B., 2021. Groundwater potential assessment using an integrated AHP-driven geospatial and field exploration approach applied to a hard-rock aquifer Himalayan watershed. Journal of Hydrology: Regional Studies, 37, 100914. |
| [83] | Saravanan, S., Saranya, T., Jennifer, J. J., Singh, L., Selvaraj, A. and Abijith, D. 2020. Delineation of groundwater potential zone using analytical hierarchy process and GIS for Gundihalla watershed, Karnataka, India. Arabian Journal of Geosciences, 13(15): 1-17. |
| [84] | Sarwar, A., Ahmad, S. R., Rehmani, M. I. A., Asif Javid, M., Gulzar, S., Shehzad, M. A., Shabbir Dar, J., Baazeem, A., Iqbal, M. A., Rahman, M. H. U. and Skalicky, M. 2021. Mapping groundwater potential for irrigation, by geographical information system and remote sensing techniques: A case study of district lower Dir, Pakistan. Atmosphere, 12(6), 669. |
| [85] | Shinde, S. P., Barai, V. N., Gavit, B. K., Kadam, S. A., Atre, A. A. and Bansod, R. D., 2022. Assessment of Groundwater Potential Zone mapping approach for semi-arid environments using GIS-based Analytical Hierarchy Process (AHP) and Multiple Influence Factors (MIF) and multi-criteria decision analysis (MCDA) techniques in Buchakewadi Watershed, Maharashtra, India. |
| [86] | Takorabt, M., Toubal, A. C., Haddoum, H. and Zerrouk, S. 2018. Determining the role of lineaments in underground hydrodynamics using Landsat 7 ETM+ data, case of the Chott El Gharbi Basin (western Algeria). Arabian Journal of Geosciences, 11(4): 1-19. |
| [87] | Tanveer Dar, Nachiketa Rai and Aadil Bhat. 2020. Delineation of potential groundwater recharge zones using analytical hierarchy process (AHP). Geology, Ecology, and Landscapes, 5(4), pp. 292-307. |
| [88] | Thapa, R., Gupta, S., Guin, S. and Kaur, H., 2017. Assessment of groundwater potential zones using multi-influencing factor (MIF) and GIS: a case study from Birbhum district, West Bengal. Applied Water Science, 7, 4117-4131. |
| [89] | Tolche Abebe Debele. 2020. Groundwater potential mapping using geospatial techniques: a case study of Dhungeta-Ramis sub-basin, Ethiopia. Geology, Ecology, and Landscapes, 5(1): 65-80. |
| [90] | Trabelsi, N., Hentati, I., Triki, I., Zairi, M. and Banton, O. 2022. A GIS-Agriflux modeling and AHP techniques for groundwater potential zones mapping. Journal of Geographic Information System, 14(2), 113-133. |
| [91] | Tripathi, R., Shyju, K. and Jasim, H. R., 2017. Evaluation of ground water potential of Nallatangaal Odai using remote sensing and GIS techniques. Int J Appl Pure Sci Agri, 3(7), 72-80. |
| [92] | Uc Castillo, J. L., Martínez Cruz, D. A., Ramos Leal, J. A., Tuxpan Vargas, J., Rodríguez Tapia, S. A. and Marín Celestino, A. E., 2022. Delineation of groundwater potential zones (GWPZs) in a semi-arid basin through remote sensing, GIS, and AHP approaches. Water, 14(13), p. 2138. |
| [93] | Ümit Yıldırım. 2021. Identification of Groundwater Potential Zones Using GIS and Multi-Criteria Decision-Making Techniques: A Case Study Upper Coruh River Basin (NE Turkey). ISPRSInternational Journal of Geo-Information, 10: 396. |
| [94] | United States Department of Agriculture (USDA). 1987. Soil mechanics level 1, Module 3. USDA Textural Classification Study Guide. Washington, DC: National Employee Development Staff. |
| [95] | Vyddiyaratnam Pathmanandakumar, Nadarajapillai Thasarathan and Manjula Ranagalage. 2021. An Approach to Delineate Potential Groundwater Zones in Kilinochchi District, Sri Lanka, Using GIS Techniques. Preprints ( |
| [96] | Waikar, M. L. and Nilawar, A. P. 2014. Identification of groundwater potential zone using remote sensing and GIS technique. International Journal of Innovative Research in Science, Engineering and Technology, 3(5): 12163-12174. |
| [97] | Woldemariam, G. W. and Harka, A. E. 2020. Effect of Land Use and Land Cover Change on Soil Erosion in Erer Sub-Basin, Northeast Wabi Shebelle Basin, Ethiopia. Land, 9(4), 1–25. |
| [98] | Yeh HF, Cheng YS, Lin HI, Lee CH. 2016. Mapping groundwater recharge potential zone using a GIS approach in Hualian River, Taiwan. Sustainable Environment Research 26(1): 33–43. |
| [99] | Yonas Gebresilasie Hagos and Tesfa Gebrie Andualem. 2021. Geospatial and multi-criteria decision approach of groundwater potential zone identification in Cuma sub-basin, Southern Ethiopia. Heliyon, 7(9): e07963. |
APA Style
Eshetu, M., Alemu, M., Haile, G. (2024). Identification and Mapping Groundwater Potential Zones Using Geospatial Analysis for Genale-Dawa Bale Sub-Basin, Oromia, Ethiopia. Earth Sciences, 13(5), 193-218. https://doi.org/10.11648/j.earth.20241305.12
ACS Style
Eshetu, M.; Alemu, M.; Haile, G. Identification and Mapping Groundwater Potential Zones Using Geospatial Analysis for Genale-Dawa Bale Sub-Basin, Oromia, Ethiopia. Earth Sci. 2024, 13(5), 193-218. doi: 10.11648/j.earth.20241305.12
AMA Style
Eshetu M, Alemu M, Haile G. Identification and Mapping Groundwater Potential Zones Using Geospatial Analysis for Genale-Dawa Bale Sub-Basin, Oromia, Ethiopia. Earth Sci. 2024;13(5):193-218. doi: 10.11648/j.earth.20241305.12
@article{10.11648/j.earth.20241305.12,
  author = {Mulugeta Eshetu and Mersha Alemu and Getachew Haile},
  title = {Identification and Mapping Groundwater Potential Zones Using Geospatial Analysis for Genale-Dawa Bale Sub-Basin, Oromia, Ethiopia
},
  journal = {Earth Sciences},
  volume = {13},
  number = {5},
  pages = {193-218},
  doi = {10.11648/j.earth.20241305.12},
  url = {https://doi.org/10.11648/j.earth.20241305.12},
  eprint = {https://article.sciencepublishinggroup.com/pdf/10.11648.j.earth.20241305.12},
  abstract = {Groundwater is one of the most crucial natural water supplies because of continuously directly or indirectly supports many domestic, agricultural, and industrial activities but is now being degraded due to various causes. Therefore, this study aimed to iddentfy and map the factors that determine groundwater potential and produce a groundwater potential zones map for Genale-Dawa Bale Sub-Basin. Accordingly, in this study, ten (10) factors affect groundwater potential at varying degrees namely: rainfall, geomorphology, LULC, lithology, soil texture, slope, elevation, topographic wetness index, drainage, and lineament density were used. Criteria weights and rankings were assigned based on expert opinion, literature review, and field survey experience, using Analytical Hierarchy Process (AHP) and ArcGIS 10.3 software to map potential groundwater zones. The results show that thematic factors such as rainfall, geomorphology, LULC, lithology, soil texture, slope, topographic wetness index, elevation, drainage density, and lineament density affect groundwater potential with weight values of 24.2%, 18.7%, 10.7%, 13%, 7.9%, 6.9%, 3.8%, 3.8%, 5.4%, and 5.7% respectively in the study area. Maps of groundwater potential zones classified into five categories: very low 366,001.80 ha (24.36%), low 249,151.07 ha (16.58%), moderate 271,817 ha (18.09%), high 278,343.13 ha (18.53%), and very high 337,194.06 ha (22.44%) for the Bale Zone and the Genale-Dawa Sub-Basin. The low to very low groundwater potentiality has been seen on the map at different distances due to the presence of hills and steep slopes, rock outcrop surfaces, clay soil textural class, low rainfall areas, very high drainage density, low lineament density, bare land are the main reasons. The validation analysis revealed a 91% confirms the very good agreement between the groundwater inventory data and the developed groundwater potential zone. The groundwater potential zones assessment and map of the current research results serve as a baseline information for planners, decision-makers, and adopters of sustainable management options, to identify suitable sites for groundwater exploration, and initial for further studies. Further studies, detailed water chemistry surveys, geophysical surveys at potential drilling sites, and grade analysis should recommended.
},
 year = {2024}
}
TY  - JOUR
T1  - Identification and Mapping Groundwater Potential Zones Using Geospatial Analysis for Genale-Dawa Bale Sub-Basin, Oromia, Ethiopia

AU  - Mulugeta Eshetu
AU  - Mersha Alemu
AU  - Getachew Haile
Y1  - 2024/10/18
PY  - 2024
N1  - https://doi.org/10.11648/j.earth.20241305.12
DO  - 10.11648/j.earth.20241305.12
T2  - Earth Sciences
JF  - Earth Sciences
JO  - Earth Sciences
SP  - 193
EP  - 218
PB  - Science Publishing Group
SN  - 2328-5982
UR  - https://doi.org/10.11648/j.earth.20241305.12
AB  - Groundwater is one of the most crucial natural water supplies because of continuously directly or indirectly supports many domestic, agricultural, and industrial activities but is now being degraded due to various causes. Therefore, this study aimed to iddentfy and map the factors that determine groundwater potential and produce a groundwater potential zones map for Genale-Dawa Bale Sub-Basin. Accordingly, in this study, ten (10) factors affect groundwater potential at varying degrees namely: rainfall, geomorphology, LULC, lithology, soil texture, slope, elevation, topographic wetness index, drainage, and lineament density were used. Criteria weights and rankings were assigned based on expert opinion, literature review, and field survey experience, using Analytical Hierarchy Process (AHP) and ArcGIS 10.3 software to map potential groundwater zones. The results show that thematic factors such as rainfall, geomorphology, LULC, lithology, soil texture, slope, topographic wetness index, elevation, drainage density, and lineament density affect groundwater potential with weight values of 24.2%, 18.7%, 10.7%, 13%, 7.9%, 6.9%, 3.8%, 3.8%, 5.4%, and 5.7% respectively in the study area. Maps of groundwater potential zones classified into five categories: very low 366,001.80 ha (24.36%), low 249,151.07 ha (16.58%), moderate 271,817 ha (18.09%), high 278,343.13 ha (18.53%), and very high 337,194.06 ha (22.44%) for the Bale Zone and the Genale-Dawa Sub-Basin. The low to very low groundwater potentiality has been seen on the map at different distances due to the presence of hills and steep slopes, rock outcrop surfaces, clay soil textural class, low rainfall areas, very high drainage density, low lineament density, bare land are the main reasons. The validation analysis revealed a 91% confirms the very good agreement between the groundwater inventory data and the developed groundwater potential zone. The groundwater potential zones assessment and map of the current research results serve as a baseline information for planners, decision-makers, and adopters of sustainable management options, to identify suitable sites for groundwater exploration, and initial for further studies. Further studies, detailed water chemistry surveys, geophysical surveys at potential drilling sites, and grade analysis should recommended.

VL  - 13
IS  - 5
ER  -
Oromia Agricutural Research Institute, Sinana Agriculture Research Center, Oromia, Ethiopia
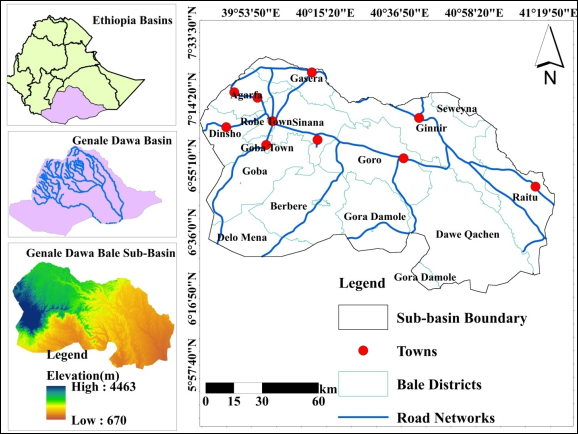
Figure 1. Map of the study area Bale Zone Genale Dawa sub-basin.
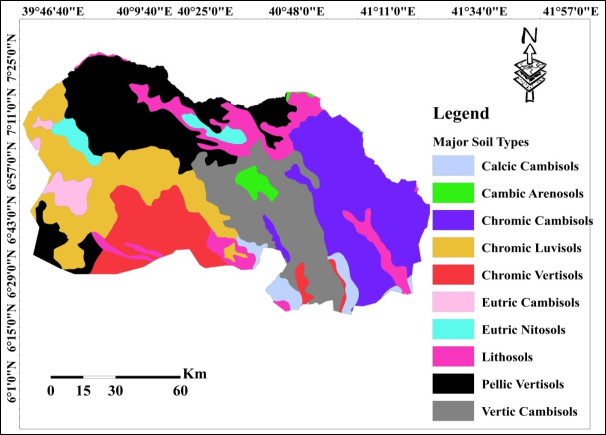
Figure 2. Soil Type map of Bale Zone Genale Dawa sub-basin.
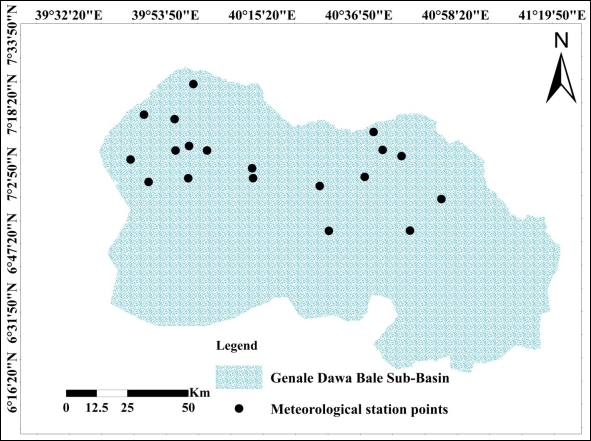
Figure 3. Meterological sations points.
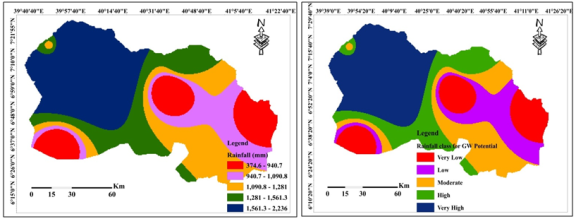
Figure 4. Rainfall map of Bale Zone Genale-Dawa sub-basin.
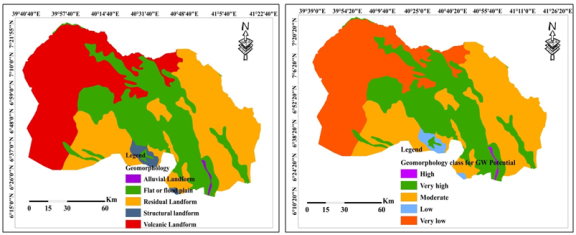
Figure 5. Geomorphology Typemap of Bale Zone Genale-Dawa sub-basin.
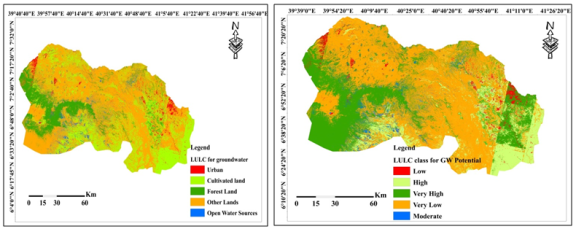
Figure 6. Land use land covermap of Bale Zone Genale-Dawa sub-basin.
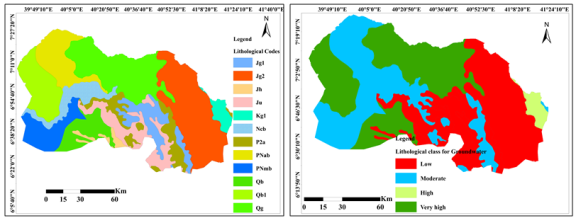
Figure 7. Lithological types map of Bale Zone Genale-Dawa sub-basin.
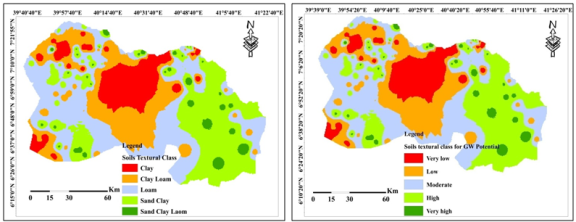
Figure 8. Soil Textural map of Bale Zone Genale-Dawa sub-basin.
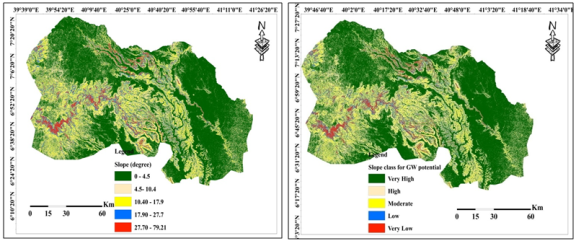
Figure 9. Slope Class map of Bale Zone Genale-Dawa sub-basin.
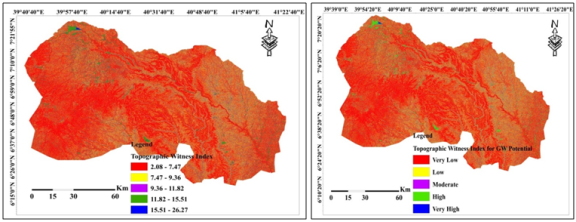
Figure 10. Topographic Witness index map of Bale Zone Genale-Dawa sub-basin.
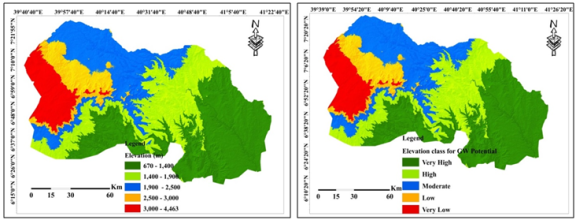
Figure 11. Elevation class map of Bale Zone Genale-Dawa sub-basin.
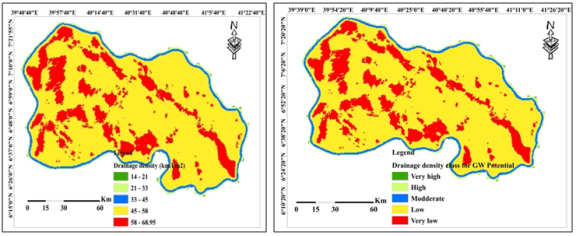
Figure 12. Drainage density class map of Bale Zone Genale-Dawa sub-basin.
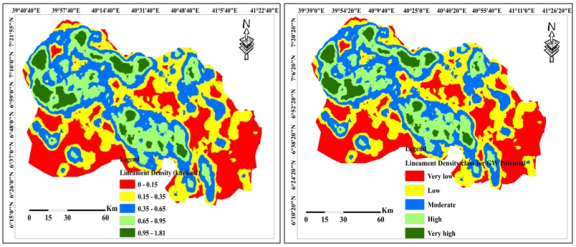
Figure 13. Lineament Density class map of Bale Zone Genale-Dawa sub-basin.
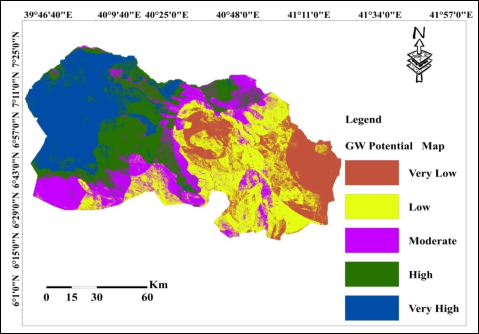
Figure 14. The Bale Zone Genale-Dawa sub-basin groundwater potential Map.
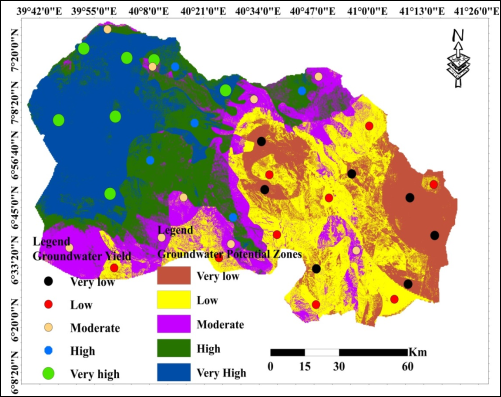
Figure 15. Groundwater potential zones validation map of Bale Zone Genale-Dawa sub-basin.
Information