Remote sensing technology and X-rays fluorescence are largely used in the applied geology field. In this study, we combine field observations and petrography, remote sensing applications through the processing of the Landsat-8 OLI, and Ultra-violet fluorescence to map geological structures, hydrothermal alteration minerals, and characterize tungsten mineralization in the Djouzami area (Adamawa, Cameroon). Landsat-8 OLI satellite imagery, was processed to detect both hydrothermal alteration zones and regional structural lineaments associated with tungsten mineralization. Fieldworks and petrography revealed hydrothermal mineral assemblage made of muscovite, chlorite, tourmaline, hematite, calcite and sericite associated to metallic minerals including tungsten and pyrite hosted in quartz veins. This hydrothermal mineral assemblage is also identified in the gold-bearing quartz veins reported in several areas along the Lom group. Band Ratio (BR) and Principal component analysis (PCA) were implemented to extract spectral information related to alteration minerals. The Band Ratios 6/7, 4/2, and 6/5 have permits to map clay, iron oxide/hydroxides, and ferrous minerals, respectively. This study demonstrates the significant potential of fieldwork and multispectral remote sensing data processing for tungsten prospecting as a mineral exploration technique in the Djouzami region. The mapping led to the detection of 1334 lineaments which show four main directions. The ENE-WSW directions corresponds to the trending of the Sanaga shear zone; the NE-SW direction represents the trending of the Djouzami and the Bétaré-Oya shear zones or the main shear zone which underline the Lom group; the N-S and E-W directions are equivalent to the trending of the foliation in the Meiganga area. Most of the high hydrothermal zones and tungsten-bearing quartz veins are located along the NE-SW lineaments or shear zone. Gold-related NE-SW trending Djouzami shear zone is also proposed. The NE-SW structure constitute certainly pathway for mineralizing fluids and ground water circulation, and control tungsten mineralization. Results proposed in this work provide important information for research of characteristic hydrothermal minerals assemblage that accompany tungsten mineralization, and for identify structures that control this mineralization in the area.
| Published in | Earth Sciences (Volume 13, Issue 3) |
| DOI | 10.11648/j.earth.20241303.12 |
| Page(s) | 97-115 |
| Creative Commons |
This is an Open Access article, distributed under the terms of the Creative Commons Attribution 4.0 International License (http://creativecommons.org/licenses/by/4.0/), which permits unrestricted use, distribution and reproduction in any medium or format, provided the original work is properly cited. |
| Copyright |
Copyright © The Author(s), 2024. Published by Science Publishing Group |
Tungsten, Scheelite, Hydrothermal Alteration, Shear Zone, Ultra-Violet (UV) Fluorescence, Landsat-8 OLIReferences
Resolution of Landsat-8 OLI / TIRS | |||
|---|---|---|---|
Band | Characteristics | Spatial resolution | Spectral resolution (μm) |
Band 1 | Aerosol | 30 m × 30 m | 0.433 – 0.453 |
Band 2 | Blue | 30 m × 30 m | 0.45 – 0.515 |
Band 3 | Green | 30 m × 30 m | 0.525 – 0.6 |
Band 4 | Red | 30 m × 30 m | 0.63 – 0.68 |
Band 5 | Near Infrared | 30 m × 30 m | 0.845 – 0.885 |
Band 6 | Mid Infrared 1 | 30 m × 30 m | 1.36 – 1.39 |
Band 7 | Mid Infrared 2 | 30 m × 30 m | 1.56 – 1.66 |
Band 8 | Panchromatic | 15 m × 15 m | 0.50 – 0.68 |
Band 9 | Cirrus | 30 m × 30 m | 2.10 – 2.30 |
Band 10 | Thermal Infrared 1 | 100 m × 100 m | 10.30 – 11.30 |
Band 11 | Thermal Infrared 2 | 100 m × 100 m | 11.50 – 12.50 |
N-S | NE-SW | ||||||||||||
|---|---|---|---|---|---|---|---|---|---|---|---|---|---|
-1.0 | -1.0 | -1.0 | 0.0 | 1.0 | 1.0 | 1.0 | -1.0 | -1.0 | -1.0 | -1.0 | -1.0 | -1.0 | -1.0 |
-1.0 | -1.0 | -1.0 | 0.0 | 1.0 | 1.0 | 1.0 | -1.0 | -1.0 | -1.0 | -1.0 | -1.0 | -1.0 | -1.0 |
-1.0 | -1.0 | -1.0 | 0.0 | 1.0 | 1.0 | 1.0 | -1.0 | -1.0 | -1.0 | -1.0 | -1.0 | -1.0 | -1.0 |
-1.0 | -1.0 | -1.0 | 0.0 | 1.0 | 1.0 | 1.0 | 0.0 | 0.0 | 0.0 | 0.0 | 0.0 | 0.0 | 0.0 |
-1.0 | -1.0 | -1.0 | 0.0 | 1.0 | 1.0 | 1.0 | 1.0 | 1.0 | 1.0 | 1.0 | 1.0 | 1.0 | 1.0 |
-1.0 | -1.0 | -1.0 | 0.0 | 1.0 | 1.0 | 1.0 | 1.0 | 1.0 | 1.0 | 1.0 | 1.0 | 1.0 | 1.0 |
-1.0 | -1.0 | -1.0 | 0.0 | 1.0 | 1.0 | 1.0 | 1.0 | 1.0 | 1.0 | 1.0 | 1.0 | 1.0 | 1.0 |
E-W | NW-SE | ||||||||||||
0.0 | 0.0 | 0.0 | -0.7 | -1.4 | -1.4 | -1.4 | -1.0 | -1.0 | -1.0 | 0.0 | 1.0 | 1.0 | 1.0 |
0.0 | 0.0 | 0.0 | -0.7 | -1.4 | -1.4 | -1.4 | -1.0 | -1.0 | -1.0 | 0.0 | 1.0 | 1.0 | 1.0 |
0.0 | 0.0 | 0.0 | -0.7 | -1.4 | -1.4 | -1.4 | -1.0 | -1.0 | -1.0 | 0.0 | 1.0 | 1.0 | 1.0 |
1.4 | 1.4 | 1.4 | 0.0 | -0.7 | -0.7 | -0.7 | -1.0 | -1.0 | -1.0 | 0.0 | 1.0 | 1.0 | 1.0 |
1.4 | 1.4 | 1.4 | 0.7 | 0.0 | 0.0 | 0.0 | -1.0 | -1.0 | -1.0 | 0.0 | 1.0 | 1.0 | 1.0 |
1.4 | 1.4 | 1.4 | 0.7 | 0.0 | 0.0 | 0.0 | -1.0 | -1.0 | -1.0 | 0.0 | 1.0 | 1.0 | 1.0 |
1.4 | 1.4 | 1.4 | 0.7 | 0.0 | 0.0 | 0.0 | -1.0 | -1.0 | -1.0 | 0.0 | 1.0 | 1.0 | 1.0 |
Sn | Parameter Settings | Parameter Value |
|---|---|---|
1 | Filter Radius (Pixels) | 5 |
2 | Edge Gradient Threshold | 10 |
3 | Curved Length Threshold (Pixels) | 10 |
4 | Line fitting Error Threshold (Pixels) | 3 |
5 | Angular difference Threshold (Degrees) | 30 |
6 | Linking Distance Threshold (Pixels) | 20 |
OLI | Operational Land Imager |
PCA | Principal Component Analysis |
BR | Band Ratio |
VNIR | Visible Infrared Imaging Radiometer Suite |
SWIR | Short-Wave Infrared |
FLAASH | Fast Line-of-Sight Atmospheric |
USGS | United States Geological Survey |
TIRS | Thermal Infrared Sensor |
RBG | Red Bleu Green |
NIR | Near Infrared |
W | Tungsten |
| [1] | Černý P, Ercit TS. The classification of granitic pegmatites revisited. (2005), Can Mineral 43. |
| [2] | Romer RL, Kroner U. Phanerozoic tin and tungsten mineralization—Tectonic controls on the distribution of enriched protoliths and heat sources for crustal melting. (2016), Gondwana Res 31: 60–95, |
| [3] | Legros H, Harlaux M, Mercadier J, Romer RL, Poujol M, Camacho A. The world-class Nanling metallogenic belt (Jiangxi, China): W and Sn deposition at 160 Ma followed by 30 my of hydrothermal metal redistribution. (2020), Ore Geology Reviews 117: 103302 (Chine). Sciences de la Terre. Université de Lorraine. |
| [4] | Polya DA, Foxford KA, Stuart F, Boyce A, Fallick AE. Evolution and paragenetic context of low δD hydrothermal fluids from the Panasqueira W-Sn deposit, Portugal: Etat de l’art 36 new evidence from microthermometric, stable isotope, noble gas and halogen analyses of primary fluid inclusions. (2000), Geochim Cosmochim Acta 64: 3357-3371. |
| [5] | Cheval-Garabédian F, Faure M, Marcoux E, Gouin J, Picault M. The La Bellière gold and antimony district (French Armorican Massif): a two-stage evolution model controlled by Variscan strikeslip tectonic. (2020), Ore Geol Rev 125: 103–681. |
| [6] | Matthieu Harlaux, Christian Marignac, Julien Mercadier, Marc Poujol, Marie-Christine Boiron, Kalin Kouzmanov, Alfredo Camacho, Saïda Alikouss, Benjamin Roméo, Bernard Mouthier and Michel CuneyMultistage development of a hydrothermal W deposit during the Variscan late-orogenic evolution: the Puy-les-Vignes breccia pipe (Massif Central, France). 2021. BSGF - Earth Sciences Bulletin, 192, 33. |
| [7] | Qiangwei Su, J Mao, J Sun, Zhao L, Xu S. Geochemistry and origin of scheelites from the Xiaoyao tungsten skarn deposit in the Jiangnan tungsten belt, SE China. (2020), Minerals. |
| [8] | Melleton JEF et Gloaguen E. Les techniques d’exploration minière utilisées pour la recherche de l’or. 2018, Bureau de recherches géologiques et minières (BRGM). Réalités industrielles - annales des mines. |
| [9] | Van Ruitenbeek FJA, Cudahy TJ, Van der Meer FD, Hale M. Characterization of the hydrothermal systems associated with Archean VMS – mineralization at Panorama, Western Australia, using hyperspectral, geochemical and geothermometric data. (2012), Ore geology reviews 45: 33–46. |
| [10] | Petrovic A, Khan SD, Thurmond AK. Integrated hyperspectral remote sensing, geochemical and isotopic studies for understanding hydrocarbon-induced rock alterations. (2012), Mar Pet Geol 35: 292–308. |
| [11] | Shi P, Fu B, Ninomiya Y, Sun J, Li Y. Multispectral remote sensing mapping for hydrocarbon seepage-induced lithologic anomalies in the Kuqa foreland basin, south Tian Shan. (2012), J Asian Earth Sci 46: 70–77. |
| [12] | Lammoglia T, Filho CRS. Spectroscopic characterization of oils yielded from Brazilian offshore basins: Potential applications of remote sensing. (2011), Remote Sens Environ 115: 2525–2535. |
| [13] | Aminzadeh B, Samani F. Identifying the boundaries of the historical site of Persepolis using remote sensing. (2006), Remote Sens Environ 102: 52–62. |
| [14] | Watts, D., Harris, N. Mapping granite and gneiss in domes along the North Himalaya antiform with ASTER SWIR band ratios. (2005), Geological Society of America Bulletin. v. 117(7-8), p. 879-886. |
| [15] | Vaughan RG, Hook SJ, Calvin WM, Taranik JV. Surface mineral mapping at Steamboat Springs, Nevada, USA, with multi-wavelength thermal infrared images. (2005), Remote Sens Environ 99: 140–158. |
| [16] | Galvão, L. S., Almeida-Filho, R., Vitorello, I. Spectral discrimination of hydrothermally altered materials using ASTER short-wave infrared bands: evaluation in a tropical savannah environment. (2005), Int. J. Appl. Earth Obs. Geoinformation 7, 107–114. |
| [17] | Hellman MJ, Ramsey MS. Analysis of hot springs and associated deposits in Yellowstone National Park using ASTER and AVIRIS remote sensing. (2004), J Volcanol Geotherm Res 135: 195–219. |
| [18] | Kucukkaya AG. Photogrammetry and remote in archeology. (2004), J Quant Spectroscopy Radiative Transf 88: 83–88. |
| [19] | Takodjou Wambo JD, Ganno S, Djonthu Lahe YS, Kouankap Nono GD, Fossi DH, Tchouatcha MS, Nzenti JP. Geostatistical and GIS analysis of the spatial variability of alluvial gold content in NgouraColomines area, Eastern Cameroon: Implications for the exploration of primary gold deposit. (2018), J Afr Earth Sci 142: 138–157. |
| [20] | Takodjou, W. J. D., Pour, A. B., Ganno, S., Asimow, P. D., Zoheir, B., Salles, R. d. R., Muslim, A. M. Identifying high potential zones of gold mineralization in a sub-tropical region using Landsat-8 and ASTER remote sensing data: A case study of the Ngoura-Colomines goldfield, eastern Cameroon. (2020), Ore Geology Reviews, 122, 103530. |
| [21] | Ketchaya, Y. B., Dong, G., Santosh, M., & Lemdjou, Y. B. Microchemical signatures of placer gold grains from the Gamba district, northern Cameroon: Implications for possible bedrock sources. (2022), Ore Geology Reviews, 141, 104640. |
| [22] | Sabins F. Remote sensing for mineral exploration. (1999), Ore Geol Rev 14: 157–183. |
| [23] | Rajesh HM. Application of remote sensing and GIS in mineral: ressource mapping-and overview. (2004), J Mineral Petrol Sci 99(3): 83–103. |
| [24] | Moradi M, Basiri S, Kananian A, Kabiri K. Fuzzy logic modeling for hydrothermal gold mineralization mapping using geochemical, geological, ASTER imageries and other geo-data, a case study in Central Alborz, Iran. (2014), Earth Sci Inf 8: 197–205. |
| [25] | Frutuoso, R.; Lima, A.; Teodoro, A. C. Application of remote sensing data in gold exploration: Targeting hydrothermal alteration using Landsat 8 imagery in northern Portugal. (2021), Arab. J. Geosci. 14, 1–18. 6. |
| [26] | Anaba Fotze, Q. M., Bikoro Bi-Alou, M., Ndougsa-Mbarga, T., Bailly, L., Bernard, J., Penaye, J., Sep Nlomngan, J. P., Djieto Lordon, A. E., Ketchaya, Y. B., & Moussango Ibohn, P. A. Integrating Aster 07XT, Landsat 8, and aeromagnetic data for the delineation of potential mineralization sites in North Cameroon. (2022), Geological Journal, 1–23. |
| [27] | Pour, B. A., Hashim, M., a Marghany, M. Exploration of gold mineralization in a tropical region using Earth Observing-1 (EO1) and JERS-1 SAR data: a case study from Bau gold field, Sarawak, Malaysia. (2014). Arabian Journal of Geosciences 7(6), 2393-2406. |
| [28] | Tohid Y, Farhang A, Ali A, Ali AC. Integrating geologic and Landsat-8 and ASTER remote sensing data for gold exploration: a case study from Zarshuran Carlin-type gold deposit, NW Iran. (2018), Arabian Journal of Geosciences 11: 482 |
| [29] | Danra Moh Guela Guy Basile, Tchameni Rigobert, Daouda Dawaï, Fosso Tchunte Periclex Martial, Awé Salomon, and Bisségué Jean Claude. “Geological Mapping of the Panafrican Mokong Gneisess and Granitoides (Far North Cameroon): Contribution of SEMI-automatic Processing from Landsat 8 OIL/TIRS Images. (2019), Journal of Geosciences and Geomatics, vol. 7, no. 2: 80-87. |
| [30] | Bolouki SM, Ramazi HR, Maghsoudi A, Pour AB, Sohrabi G. A remote sensing-based application of Bayesian networks for epithermal gold potential mapping in Ahar-Arasbaran area, NW Iran. (2020), Remote Sens 12: 105. |
| [31] | Mahboob MA, Genc B, Celik T, Ali S, Atif I. Mapping hydrothermal minerals using remotely sensed reflectance spectroscopy data from Landsat. Journal of the Southern African Institute of Mining and Metallurgy. (2019), 119(3): 249–89. Available from: |
| [32] | Pour, A. B., Hashim, M., Hong, J. K., Park, Y. Lithological and alteration mineralmapping in poorly exposed lithologies using Landsat-8 and ASTER satellite data: Northeastern Graham Land, Antarctic Peninsula. (2019), Ore Geology Reviews. v. 108, p. 112-133. |
| [33] | Beygi, S., Talovina, I. V., Tadayon, M., Pour, A. B. Alteration and structural features mapping in Kacho-Mesqal zone, Central Iran using ASTER remote sensing data for porphyry copper exploration. (2020), International Journal of Image and Data Fusion, Article in press. |
| [34] | Bien À Nwos Prisca-Gaëlle, Mounchili Ibrahim, Apouamoun Yiagnigni Roland, Etoundi Jean, Ndongue Constantin and Meying Arsène. The contribution of remote sensing and aeromagnetism to gold prospecting. (2021) the case of the Meiganga zone, Cameroon. |
| [35] | Gazel, J., Gerard, G. Carte géologique de reconnaissance du Cameroun au 1/500000, feuille de Batouri-Est avec notice explicative. 1954, Mémoire Direction des Mines et de la Géologie, Yaoundé, Cameroun, 43 p. |
| [36] |
Milesi JP, Toteu SF, Deschamps Y, Feybesse JL, Lerouge C, Cocherie A, Penaye J, Tchameni R, Moloto-A-Kenguemba G, Kampunzu HAB, Nicol N, Duguey E, Leistel JM, Saint-Martin M, Ralay F, Heinry C, Bouchot V, Doumnang Mbaigane JC, Kanda Kula V, Chene F, Monthel J, Boutin P, Cailteux J. An overview of the geology and major ore deposits of Central Africa: explanatory note for the 1: 4,000,000 map “Geology and major ore deposits of Central Africa. (2006), J Afr Earth Sci 44(4): 571–595.
https://doi.org/10.1016/j.jafrearsci (2005.10.016) |
| [37] | Azeuda Ndonfack, K. I., Xie, Y. L., Goldfarb, R. J, Gold occurrences of the Woumbou-Colomine-Kette district, eastern Cameroon: ore-forming constraints from petrography, SEM-CL imagery, fluid inclusions, and C-O-H-S isotopes. (2021a), Miner. Depos. |
| [38] | Azeuda Ndonfack, K. I., Xie, Y., Goldfarb, R., Zhong, R., Qu, Y. Genesis and mineralization style of gold occurrences of the Lower Lom Belt, Betare Oya district, eastern Cameroon. (2021b), Ore Geology Reviews. |
| [39] | Ayiwouo1 MN, Mambou1 LLN, Boroh WA, Takougang Ski, Ngounouno I, Spatial variability of trace metals in sediments along the Lom River in the gold mining area of Gankombol (Adamawa Cameroon) using geostatistical modeling methods Modeling. (2022), Earth Systems and Environment |
| [40] | Toteu SF, Penaye J, Djomani YP. Geodynamic evolution of the Pan-African belt in central Africa with special reference to Cameroon. (2004), J Earth Sci 41(1): 73–85. |
| [41] | Penaye J, Toteu SF, Tchameni R, Van Schmus WR, Tchakounté J, Ganwa A, Minyem D, Nsifa EN. The 2.1 Ga West central African belt in Cameroon: extension and evolution. (2004), J Afr Earth Sci 39(3–5): 159–164. |
| [42] | Ganwa AA, Frisch W, Siebel W, Ekodeck GE, Shang CK, Ngako V. Archean inheritances in the pyroxene–amphibole-bearing gneiss of the Méiganga area (Central North Cameroon): geochemical and 207Pb/206Pb age imprints. (2008), C R Acad Sci Paris 340(4): 211–222. |
| [43] | Ganwa AA, Siebel W, Frisch W, Shang CK, Ekodeck GE. Geochemistry and geochronology of the Méiganga metadiorite: implications on the timing of D2 deformational phase in Adamawa Yadé Domain in Cameroon. (2011), Int J Biol Chem Sci 5(4): 1754–1767. |
| [44] | Ganwa AA, Klötzli US, Hauzenberger C Evidence for Archean inheritance in the pre-Panafrican crust of Central Cameroon: insight from zircon internal structure and LA-MC-ICP-MS U-Pb ages. (2016), J Afr Earth Sci 120: 12–22. |
| [45] | Saha Fouotsa AN, Vanderhaeghe O, Barbey P, Eglinger A, Tchameni R, Zeh A, Tchunte PF, Nomo EN. The geologic record of the exhumed root of the Central African Orogenic Belt in the central Cameroon domain (Mbé–Sassa-Mbersi region). (2019), J Afr Earth Sci 151: 286–314. |
| [46] | Soba D, Michard A, Toteu SF, Norman DI, Penaye J. Données géochronologiques nouvelles (Rb-Sr, U-Pb et Sm-Nd) sur la zone mobile panafricaine de l’Est du Cameroun: âge protérozoïque supérieur de la série de Lom. (1991), C R Acad Sci Paris 312(12): 1453–1458. |
| [47] | Ngako V, Affaton P, Nnange JM, Njanko T. Pan-African tectonic evolution in central and southern Cameroon: transpression and transtension during sinistral shear movements. (2003), J Afr Earth Sci 36(3): 207–214. |
| [48] | Toteu SF, Penaye J, Deloule E, Van Schmus WR, Tchameni R. Diachronous evolution of volcano-sedimentary basins north of the Congo craton: insights from U–Pb ion microprobe dating of zircons from the Poli, Lom and Yaoundé Groups (Cameroon). (2006), J Afr Earth Sci 44(4–5): 428–442. |
| [49] | Tchameni R, Pouclet A, Penaye J, Ganwa AA, Toteu SF. Petrography and geochemistry of the Ngaoundéré Pan-African granitoids in Central North Cameroon: implications for their sources and geological setting. (2006), J Afr Earth Sci 44(4): 511–529. |
| [50] | Njanko, T., Nedelec, A., Affaton, P. Synkinematic high - K calc-alkaline plutons associated to the Pan-African Central Cameroon Shear Zone (W-Tibati area): Petrology and geodynamic significance. (2006), Journal of African Earth Sciences 44, 494-510. |
| [51] | Nzenti JP, Kapajika B, Wörner G, Lubala TR. Synkinematic emplacement of granitoids in a Pan-African shear zone in Central Cameroon. (2006), J Afr Earth Sci 45(1): 74–86. |
| [52] | Kankeu B, Greiling RO. Magnetic fabrics (AMS) and transpression in the Neoproterozoic basement of Eastern Cameroon (Garga-Sarali area). (2006), Neues Jahrbuch für Geologie und Paläontologie - Abhandlungen: 263–287. |
| [53] | Kankeu B, Greiling RO, Nzenti JP. Pan-African strike–slip tectonics in eastern Cameroon magnetic fabrics (AMS) and structure in the Lom basin and its gneissic basement. (2009), Precambrian Res 174(3): 258–272. |
| [54] | Asaah, A. V., Zoheir, B., Lehmann, B., Frei, D., Burgess, R., Suh, C. E., Geochemistry and geochronology of the ~620 Ma gold-associated Batouri granitoids. Cameroon. (2015), International Geology Review 57(11–12), 1485–1509. |
| [55] | Nomo Negue E, Takodjou Wambo HD, Yamgouot Ngounouno F, Negou Nembouet J, Teda Soh AC, Tsassé Nganno AS, Fossi DH, Tchameni R. Searching gold origin through litho-structural analysis and morphological characterization of alluvial gold nuggets in the Guiwa-Yangamo area (Batouri goldfield, Eastern Cameroon). (2021), Arab J Geosci 14: 1973. |
| [56] | Lemdjou YB, Huan Li,. Whattam SA, Azeuda Ndonfack KI, De pesquidoux I. TT, Ketchaya YB, Quaye JA., Nguimatsia Dongmo FW. Petrogenesis, tectonic setting and geodynamic implications of Ouaden, Doumba Bello, and Ngoura granitic plutons (Eastern Cameroon): Constraints from elemental and Sr−Nd−Hf isotopic data and zircon U−Pb ages. (2022), journal lithos. |
| [57] | Nkoumbou C, Barbey P, Yonta-Ngouné C, Paquette J-L, Villiéras F. Pre-collisional geodynamic context of the Southern margin of the Pan-African fold Belt in Cameroon. (2014) J Afri Eath Sci 99(2): 245-260. |
| [58] | Tchakounté J, Eglinger A, Toteu SF, Zeh A, Nkoumbou C, Mvondo Ondoa J, Penaye J, de Wit M, Barbey P The AdamawaYadé domain, a piece of Archaean crust in the Neoproterozoic Central African Orogenic belt (Bafia area, Cameroon). (2017), Precambrian Res 299: 210–229. |
| [59] | Ngako V, Njonfang E, Aka FT, Affaton P, Nnange JM. The North–South Paleozoic to Quaternary trend of alkaline magmatism from Niger–Nigeria to Cameroon: complex interaction between hotspots and Precambrian faults. (2006), J Afr Earth Sci 45(3): 241–256. |
| [60] | Ngounouno F. Y., Nomo E. E., Kolb J., Walter B., Teda A. C. S., Patten C., Ismaïla Ngounouno. Tectonic setting, fluid inclusion and gold mineralization of the southwest Poli region (northern Cameroon Domain). (2022), J Afr Earth Sci 194, 104579. |
| [61] | Njonfang E, Nono A, Kamgang P, Ngako V, Tchoua FM. Cameroon Line alkaline magmatism (central Africa): a reappraisal. (2011), Geol Soc Am Spec Pap 478: 173–192. |
| [62] | Cornacchia M, Dars R Un trait structural majeur du continent Africain; les lineaments centrafricains du Cameroun au Golfe d’Aden. (1983), Bulletin de la Société Géologique de France S7-XXV (1): 101–109. |
| [63] | Almeida FFM, Hasui Y, De Brito Neves BB, Fuck RA. Brazilian Structural Provinces: an introduction. (1981), Earth-Science Review 17: 1-29. http://dx.doi.org/10.1016/0012-8252(81)90003-9 |
| [64] | Njonfang E, Ngako V, Moreau C, Affaton P, Diot H. Restraining bends in high temperature shear zones: the “Central Cameroon Shear Zone”, Central Africa. (2008), J Afr Earth Sci 52(1): 9–20. |
| [65] | Ngako F, Jegouzo P, Nzenti JP. Le cisaillement centre camerounais. Rôle structural et géodynamique dans l’orogenèse panafricaine. (1991), C Acad sci, Sér 2, Méc phys chim sci univers sci terre 313(4): 457–463. |
| [66] | Soba, D. Le granite de Nyibi et son aureole de contact. (1975), C R Acad Sci Paris 280: 1935. |
| [67] | Lasserre, M. and Soba, D. Âge libérien des granitoïdes et des gneiss à pyroxène du Cameroun méridional. (1976), Bulletin du Bureau de Recherches Géologiques et Minières, 2, 17-32. |
| [68] | Toteu SF, Van Schmus RW, Penaye J, Michard A. New U-Pb and Sm–Nd data from North-Central Cameroon and its bearing on the Pre–Pan–African history of Central Africa. (2001), Precambrian Res 108: 45–73. |
| [69] | Suh CE, Lehmann B, Mafany GT. Geology and geochemical aspects of lode gold mineralization at Dimako–Mboscorro, SE Cameroon. (2006), Geochemistry: Exploration, Environment, Analysis 6(4): 295–309. |
| [70] | Vishiti, A., Suh, C. E., Lehmann, B., Shemang, E. M., Ngome, N. L. J., Nshanji, N. J., Chinjo, E. F., Mongwe, O. Y., Egbe, A. J., Petersen, S. Mineral chemistry, bulk rock geochemistry, and S‐isotope signature of lode‐gold mineralization in the Bétaré Oya gold district, south‐east Cameroon. (2017), Geological journal, 1-18. http://dx.doi.org/10.1002/gj.3093 |
| [71] | Castaing, C., Feybesse, J. L., Thieblemont, D., Triboulet, C., and Chevremont, P. Palaeogeographical reconstructions of the Pan-African/Brasiliano orogen: closure of an oceanic domain or intracontinental convergence between major blocks? (1994), Precambrian Research, 67: 327–344. |
| [72] | Soba D La série de Lom: étude géologique et géochronologique d’un bassin volcanosédimentaire de la chaîne panafricaine à l’Est du Cameroun. (1989), Thèse Doctorat d’Etat, Univ. Pierre et Marie Curie Paris 6, 198p. |
| [73] | Rajendran, S., Nasir, S., Kusky, T. M., Al-Khirbash, S. “Remote sensing based approachfor mapping of CO2 sequestered regions in Semail ophiolite massifs of the Sultanate of Oman”. (2014), Earth Sci. Rev. 135, 122–140. |
| [74] | Cooley, T., Anderson, G. P., Felde, G. W., Hoke, M. L., Ratkowski, A. J., Chetwynd, J. H., Gardner, J. A., Adler-Golden, S. M., Matthew, M. W., Berk, A., Bernstein, L. S., Acharya, P. K., Miller, D., Lewis P. FLAASH, a MODTRAN4-based atmospheric correction algorithm, its application and validation. (2002), Proceedings of the Geoscience and Remote Sensing Symposium, IEEE International, 3, 1414–1418. |
| [75] | Rajendran, S., Nasir, S., Kusky, T. M., Ghulam, A., Gabr, S., El Ghali, M. “Detection of hydrothermal mineralized zones associated with Listwaenites rocks in the Central Oman using ASTER data”. (2013), Ore Geol. Rev. 53, 470–488. |
| [76] | Salem, S. M., El Sharkawi, M., El-Alfy, Z., Soliman, N. M., Ahmed, S. E.,. Exploration of gold occurrences in alteration zones at Dungash district, Southeastern Desert of Egypt using ASTER data and geochemical analyses. (2016), J. Afr. Earth Sc. 117, 389–400. |
| [77] | Andongma, W. T.; Gajere, J. N.; Amuda, A. K.; Edmond, R. R. D.; Faisal, M.; Yusuf, Y. D. Mapping of hydrothermal alterations related to gold mineralization within parts of the Malumfashi Schist Belt, North-Western Nigeria. (2021), Egypt. J. Remote Sens. Sp. Sci. 24, 401–417. |
| [78] | Inzana J., Kusky T., Higgs G., Tucker R. Supervised classifications of Landsat TM band ratio images and Landsat TM band ratio image with radar for geological interpretations of central Madagascar. 2003, Journal of African Earth Sciences – Elsevier. |
| [79] | Traore, M., Takodjou Wambo, J. D., Ndepete, C. P., Tekin, S., Pour, A. B., Muslim, A. M. Lithological and alteration mineral mapping for alluvial gold exploration in the south east Birao area, Central African Republic using Landsat-8 Operational Land Imager (OLI) data. (2020), Journal of African Earth Sciences 170, 103933. |
| [80] | Bonn, F. et Rochon, G. Précis de Télédétection. Principes et méthodes. (1992), Presse de l’université de Québec / AUPELF, vol. 1,485 p. |
| [81] | Cheng, Q., Jing, L., Panahi, A. Principal component analysis with optimum order sample correlation coefficient for image enhancement. (2006), Int. J. Remote Sens. 27(16), 3387–3401. |
| [82] | Gupta, R. P. Remote Sensing Geology, 3rd edn. Springer, Berlin, Germany, pp 180-190, 235-240, and 332-336. |
| [83] | Shahriari, H.; Ranjbar, H.; Honarmand, M. Image segmentation for hydrothermal alteration mapping using PCA and concentration–area fractal model. (2013), Nat. Resour. Res., 22, 191–206. |
| [84] | Bell, R. T. & Jefferson, CW. An hypothesis for an Australian-Canadian connection in the Late Proterozoic and the birth of the Pacific Ocean. (1987), Proceedings 'Pacific Rim Congress' 87, 39-50. |
| [85] | Trippa, G. I., Vearncombe, J. R. Fault/fracture density and mineralization: a contouring method for targeting in gold exploration. (2002), Journal of Structural Geology 26(2004), 1087–1108. |
| [86] | Li, N., Frei, M., Altermann, W. Textural and knowledge-based lithological classification of remote sensing data in Southwestern Prieska sub-basin, Transvaal Supergroup, South Africa. (2010), Journal of African Earth Sciences 60 237–246. |
| [87] | Chavez Pat, JR and Brian Bauer. An automatic optimum kernel-size selection technique for edge enhancement. (1982), Remote sensing of environment 12-23-38. |
| [88] | Koffi Yao, T., Fouché-Grobla, O., Yéi Oga, M.-S., Tchimou Assoma, V. Extraction de linéaments structuraux à partir d’images satellitaires et estimation des biais induits en milieu de socle précambrien métamorphisé. (2012), Rev. Teledetect. 10(4), 161–178. |
| [89] | Scanvic, J.-Y. Utilisation de la télédétection dans les Sciences de la terre. (1983), Manuels et méthodes, 7, B. R. G. M., Orléans, 158 p. |
| [90] | Marion, A. Introduction aux techniques de traitement d’images. (1987), Eyrolles, Paris, pp. 127-167. |
| [91] | Kouamé, K. F., Gioan, P., Biémi, J. et Affian, K. Méthode de cartographie des discontinuités-images satellitales: exemple de la région semi-montagneuse à l’ouest de la Côte d’Ivoire. (1999), Télédétection, vol. 2, pp. 139-156. |
| [92] | Lasm T., Hydrogéologie des réservoirs fracturés de socle: Analyses statistiques et géostatistique de la fracturation et des propriétés hydrauliques. Application à la région des montagnes de Côte d'Ivoire (Domaine Archéen). (2000), Thèse unique de doctorat Université de Poitier, 272p. |
| [93] | Youssouf, K., Alain, N. S., Nakolendousse, S. Les différentes signatures des fractures de socle cristallin en zone sahélo-soudanienne du Burkina Faso (bassin versant de Bidi, province du Yatenga). (2003), Revue de Télédétection 3, 419–427. |
| [94] | Moore, G. K., Waltz, F. A.,. Objective procedure for lineament enhancement and extraction. (1983), Photogrammetric Engineering & Remote Sensing, 49(5): 641–647. |
| [95] | Karnieli A, Meiseis A, Fisher L, Arkin Y. Automatic extraction and evaluation of geological linear features from digital remote sensing data using a Hough Transform. (1996), Photogramm Eng Remote Sens 62:525–531. |
| [96] | Wladis, D., Automatic lineament detection using digital elevation models with second derivative filters. (1999), Photogrammetric Engineering and Remote Sensing 65(4), 453–458. |
| [97] | Youan Ta M. Contribution de la tétédétection des systèmes d’informations géographiques à la prospection hydrogéologique du socle Précambrien d’Afrique de l’Ouest: cas de la Région de Bondokou (Nord-est de la Cote Ivoire). (2008), Thèse de Doctorat à l’université de Cocody, 273pages. |
| [98] | Caldini F. G., Posavec M., Azuelos M. J. Carte photogéologique de la Côte d’Ivoire à 1/200 000, Feuille de Nassian, Commission du Canada. (1978), Société pour de Développement Minier de la Côte d’Ivoire (SODEMI). |
| [99] | Delor C., Simeon Y., Vidal M., Zeade Z., Kone Y., Adou M., Dibouahi J., Irie D. B., Ya B. D., N’da D., Pouclet A., Konan G., Diaby I., Chiron J-C., Dommanget A., Kouamelan A., Peucat J. J., Cocherie A. Et Cautru J. P. (1995), Carte géologique de la Côte d’Ivoire à 1/200 000, feuille Nassian, Mémoire n°9 de la Direction des Mine et de la Géologie, Abidjan. |
| [100] | Zeade, Z., Delor, C., Simeon, Y., Yao, B. D., Vidal M, Sonnendrucker, P., Diaby, I., Cautru, J. p. (1995), Notice explicative de la carte Géologique de la Côte d’Ivoire à 1/200 000, Feuille Bondoukou, Mémoire de la Direction des Mines et de la Géologie de la Côte d’Ivoire, n°10 Abidjan, Côte d’Ivoire. |
| [101] | Khosroshahizadeh, S., Pourkermani, M., Almasiyan, M., Arian, M., Khakzad, A., Evaluation of Structural Patterns and Related Alteration and Mineralization Zones by Using ASTER Imagery in Siyahrood Area (East Azarbaijan-NW Iran). (2015), Journal of Geosciences and Geomatics 95. Open Journal of Geology, 5, 589-610. |
| [102] | Faillat, J.-P. Aquifères fissurés en zone tropicale humide: structure, hydrodynamique et hydrochimie. (1986), Thèse de Doctorat 'État, Université du Languedoc-Monptpellier II, 536 p. |
| [103] | Lasm, T. et Razack, M. Lois d'échelle dans la fracturation de roches dures cristallines et dans le réseau hydrographique. (2001), Compte Rendu de l’Académie des Sciences, Series IIA - Earth and Planetary Science, vol. 333, n°4, pp. 225-232. |
| [104] | Lasm T., Razack M., Youan Ta M. Geostatistical assessment of the transmissivity of crystalline fissured aquifer in the Bondoukou region, north-eastern Côte d’Ivoire. (2004), Applied groundwater Studies in Africa; n° 13, chapiter 28, 473-485. |
| [105] | Kouamé K. F., Akaffou A. G., Lasm T., De Dreuzy J. R., Davy P. & Bour O. Simulation des écoulements dans les réservoirs fracturés: application au socle Archéen de Touba (Nord-Ouest de la Côte d'Ivoire). (2005), Actes du Colloque Internationale SITIS 05, Yaoundé (Cameroun), 27 Nov.-1er Déc. pp. 39-46. |
| [106] | Cheval-Garabédian F, Faure M, Marcoux E, Poujol M. The tungsten-gold veins of Bonnac (French Massif Central): new constraints for a Variscan granite-related genesis. (2021), BSGF - Earth Sciences Bulletin 192: 7. |
| [107] | Poitrenaud T, Marcoux É, Augier R, Poujol M. The perigranitic W-Au Salau deposit (Pyrenees, France): polyphaser genesis of a late Variscan intrusion related deposit. (2021), BSGF - Earth Sciences Bulletin 192: 22. |
| [108] | Loughlin W. Principal component analysis for alteration mapping. (1991), Photogrammetric Engineering and Remote Sensing, 57, 1163–1169. |
| [109] | Zhang, X., Pazner, M., Duke, N. Lithologic and mineral information extraction for gold exploration using ASTER data in the south chocolate mountains (California). (2007), ISPRS Journal of Photogrammetry & Remote Sensing, 62, 271–282. |
| [110] | Liu X, Xing H, Zhang D. Influences of hydraulic fracturing on fluid flow and mineralization at the vein-type tungsten deposits in southern China. (2017), Geofluids: 1–11. |
| [111] | Hammam, A., Gaber, A., Abdelwahed, M., Hammed, M. Geological mapping of the Central Cairo-Suez District of Egypt, using space-borne optical and radar dataset. (2018), the Egyptian Journal of Remote Sensing and Space Sciences 23(3), 275-285. |
| [112] | Kumar, C., Chatterjee, S., Oommena, T., Guha. A. Automated lithological mapping by integrating spectral enhancement techniques and machine learning algorithms using AVIRIS-NG hyperspectral data in Gold-bearing granite-greenstone rocks in Hutti, India. (2020), Int J Appl Earth Obs Geoinformation 86, 102006. |
| [113] | Adiri, Z., Lhissou, R., El Harti, A., Jellouli, A., Chakouri, MRecent advances in the use of public domain satellite imagery for mineral exploration: A review of Landsat-8 and Sentinel-2 applications. (2020), Ore Geology Reviews 117. |
| [114] | Pour, A. B., Sekandari, M., Rahmani, O., Crispini, L., Läufer, A., Park, Y., Hong, J. K., Pradhan, B., Hashim, M., Hossain, M. S., Muslim, A. M., Mehranzamir, K., Identification of Phyllosilicates in the Antarctic Environment Using ASTER Satellite Data: Case Study from the Mesa Range, Campbell and Priestley Glaciers, Northern Victoria Land. (2021), Remote Sens. 2021, 13, 38. |
| [115] | Harlaux M, Romer RL, Mercadier J, Morlot C, Marignac C, Cuney M. 40 Ma of hydrothermal W mineralization during the Variscan orogenic evolution of the French Massif Central revealed by U-Pb dating of wolframite. (2018), Miner Depos 53: 21–51. |
| [116] | Gabr S, Ghulam A, Kusky T. Detecting areas of high-potential gold mineralization using ASTER data. (2010), Ore Geol Rev 38: 59–69. |
| [117] | Ruiz-Armenta, J. R., & Prol-Ledesma, R. M. Techniques for enhancing the spectral response of hydrothermal alteration minerals in the Thematic Mapper images of Central Mexico. (1998), International Journal of Remote Sensing, 19(10), 1981–2000. |
| [118] | Han, T. & Nelson, J. Mapping hydrothermally altered rocks with Landsat 8 imagery: Acase study in the KSM and Snow field zones, northwestern British Columbia. (2015), In: Geological Fieldwork 2014, British Columbia Ministry of Energy and Mines, British. |
| [119] | Ngassam GM, Timoleon N, Takodjou Wambo J D, Ganno S, Beiranvand AP, Ayonta PK, Fossi DH, Isabelle D. Wolf. Remote sensing satellite-based structural/alteration mapping for gold exploration in the Ketté goldfield, Eastern Cameroon. (2021), journal of African Earth Sciences |
| [120] | Dumont, J. F., Toteu, S. F., et Penaye, J. Ensembles structuraux et principales phases de déformations panafricaines dans la zone mobile du Nord Cameroun, région de Poli. (1985), Revue des Sciences et Techniques, Série Sciences de la Terre, Yaoundé, 1: 9–23. |
| [121] | Neves, SP., Melo, SC., Moura, CAV., Mariano, G., Silva, JMR. Zircon Pb-Pb geochronology of the Caruaru area, north-eastern Brazil: temporal constraints on the Proterozoic evolution of Borborema Province. (2004), International Geology Review, 46, 52-63. |
| [122] | Kankeu, B., Greiling, R. O., Nzenti, J. P., Bassahak, J., Hell, V. J.,. Strain partitioning along the neoproterozoic central Africa shear zone system: magnetic fabrics (AMS) and structures from the Meiganga area, Cameroon. (2012), Neues Jahrb. für Geol. Palaontologie Abh. 265, 27-48. |
| [123] | Vishiti, A., Suh, C. E., Etame, J. Features of gold-bearing quartz veins in an artisanal mining dominated terrain, Batouri gold district, Eastern region of Cameroon. (2019), IUGS, Episodes Vol. 42, No. 3, 199-212. |
| [124] | Al-Mokredi, M. S., Guangdao, H., Al Bassam, B. F. Using Remote Sensing Data to Delineate the Lineaments for Hydrothermal Mineral Prediction in Heqing Area, Northwest Yunnan Province, China. (2007), Journal of China University of Geosciences, vol. 18, No. 2, p. 142-147. |
| [125] | Takodjou Wambo, J. D., Ganno, S., Afahnwie, N. A., Nomo, N. E., Mvondo, O. J., Nzenti, J. P. Use of Landsat 7 ETM+ data for the geological structure interpretation: case study of the Ngoura Colomines area, Eastern Cameroon. (2016), Journal of Geoscience and Geomatics 4(3), 61–72. http://dx.doi.org/10.12691/jgg-4-3-3 |
| [126] | Nguemhe Fils, S. C., Bekele Mongo, C. H., Nkouathio, D. G., Mimba, M. E., Etouna, J, Njandjock Nouck, P., Brunot Nyeck, B. Radarsat-1 image processing for regionalscale geological mapping with mining vocation under dense vegetation and equatorial climate environment, Southwestern Cameroon. (2018), The Egyptian Journal of Remote Sensing and Space Sciences 21, S43–S54. |
| [127] | Groves DI. The crustal continuum model for late-Archaean lodegold deposits of the Yilgarn Block, Western Australia. (1993), Mineral Deposita 28(6): 366–374. |
| [128] | Chauvet A, Piantone P, Barbanson L, Nehlig P, Pedroletti I Gold deposit formation during collapse tectonics: structural, mineralogical, geochronological, and fluid inclusion constraints in the Ouro Preto gold mines, Quadril átero Ferrífero, Brazil. (2001), Econ Geol 96(1): 25–48. |
| [129] | Saint-Jean, R. The role of the eco in the context of the international charter on space and major disasters. (2005), IEEE International Geoscience and Remote Sensing Symposium (IGARSS), Seoul, Korea (South), 25-29 July, 6, 4370-4372. |
| [130] | Van Krieken AT. and Wilson CJL. Structural and timing constraints on molybdenum and tungsten mineralization at Yea, Victoria. (2016), Australian Journal of Earth Sciences. |
| [131] | De Roo J. A. Structural controls on the emplacement of the vein-type tungsten-tin ore at Mount Carbine, Queensland, Australia. (1988), Economic Geology 83(6): 1170–1180. |
| [132] | Mayachar GK. and Ghosh S. Fluid Inclusion Characteristics of Tungsten Mineralization in the Agargaon Area of Sakoli Fold Belt, Central India. (2020), Mineral Deposits. |
APA Style
Raoul, Y. W., Emmanuel, N. N., Dagwaï, N., Mouhamed, A. N., Bertrand, M. G. I., et al. (2024). Prospecting Tungsten (Scheelite) Mineralization in the Djouzami Area (Adamawa Cameroon) Using Ultra-Violet (UV) Fluorescence and Landsat-8 OLI Images. Earth Sciences, 13(3), 97-115. https://doi.org/10.11648/j.earth.20241303.12
ACS Style
Raoul, Y. W.; Emmanuel, N. N.; Dagwaï, N.; Mouhamed, A. N.; Bertrand, M. G. I., et al. Prospecting Tungsten (Scheelite) Mineralization in the Djouzami Area (Adamawa Cameroon) Using Ultra-Violet (UV) Fluorescence and Landsat-8 OLI Images. Earth Sci. 2024, 13(3), 97-115. doi: 10.11648/j.earth.20241303.12
AMA Style
Raoul YW, Emmanuel NN, Dagwaï N, Mouhamed AN, Bertrand MGI, et al. Prospecting Tungsten (Scheelite) Mineralization in the Djouzami Area (Adamawa Cameroon) Using Ultra-Violet (UV) Fluorescence and Landsat-8 OLI Images. Earth Sci. 2024;13(3):97-115. doi: 10.11648/j.earth.20241303.12
@article{10.11648/j.earth.20241303.12,
  author = {Yingyang Wanbitching Raoul and Nomo Negue Emmanuel and Nguihdama Dagwaï and Ayiwouo Ngounouno Mouhamed and Mbowou Gbambie Isaac Bertrand and Ngounouno Ismaïla},
  title = {Prospecting Tungsten (Scheelite) Mineralization in the Djouzami Area (Adamawa Cameroon) Using Ultra-Violet (UV) Fluorescence and Landsat-8 OLI Images
},
  journal = {Earth Sciences},
  volume = {13},
  number = {3},
  pages = {97-115},
  doi = {10.11648/j.earth.20241303.12},
  url = {https://doi.org/10.11648/j.earth.20241303.12},
  eprint = {https://article.sciencepublishinggroup.com/pdf/10.11648.j.earth.20241303.12},
  abstract = {Remote sensing technology and X-rays fluorescence are largely used in the applied geology field. In this study, we combine field observations and petrography, remote sensing applications through the processing of the Landsat-8 OLI, and Ultra-violet fluorescence to map geological structures, hydrothermal alteration minerals, and characterize tungsten mineralization in the Djouzami area (Adamawa, Cameroon). Landsat-8 OLI satellite imagery, was processed to detect both hydrothermal alteration zones and regional structural lineaments associated with tungsten mineralization. Fieldworks and petrography revealed hydrothermal mineral assemblage made of muscovite, chlorite, tourmaline, hematite, calcite and sericite associated to metallic minerals including tungsten and pyrite hosted in quartz veins. This hydrothermal mineral assemblage is also identified in the gold-bearing quartz veins reported in several areas along the Lom group. Band Ratio (BR) and Principal component analysis (PCA) were implemented to extract spectral information related to alteration minerals. The Band Ratios 6/7, 4/2, and 6/5 have permits to map clay, iron oxide/hydroxides, and ferrous minerals, respectively. This study demonstrates the significant potential of fieldwork and multispectral remote sensing data processing for tungsten prospecting as a mineral exploration technique in the Djouzami region. The mapping led to the detection of 1334 lineaments which show four main directions. The ENE-WSW directions corresponds to the trending of the Sanaga shear zone; the NE-SW direction represents the trending of the Djouzami and the Bétaré-Oya shear zones or the main shear zone which underline the Lom group; the N-S and E-W directions are equivalent to the trending of the foliation in the Meiganga area. Most of the high hydrothermal zones and tungsten-bearing quartz veins are located along the NE-SW lineaments or shear zone. Gold-related NE-SW trending Djouzami shear zone is also proposed. The NE-SW structure constitute certainly pathway for mineralizing fluids and ground water circulation, and control tungsten mineralization. Results proposed in this work provide important information for research of characteristic hydrothermal minerals assemblage that accompany tungsten mineralization, and for identify structures that control this mineralization in the area.
},
 year = {2024}
}
TY  - JOUR
T1  - Prospecting Tungsten (Scheelite) Mineralization in the Djouzami Area (Adamawa Cameroon) Using Ultra-Violet (UV) Fluorescence and Landsat-8 OLI Images

AU  - Yingyang Wanbitching Raoul
AU  - Nomo Negue Emmanuel
AU  - Nguihdama Dagwaï
AU  - Ayiwouo Ngounouno Mouhamed
AU  - Mbowou Gbambie Isaac Bertrand
AU  - Ngounouno Ismaïla
Y1  - 2024/06/27
PY  - 2024
N1  - https://doi.org/10.11648/j.earth.20241303.12
DO  - 10.11648/j.earth.20241303.12
T2  - Earth Sciences
JF  - Earth Sciences
JO  - Earth Sciences
SP  - 97
EP  - 115
PB  - Science Publishing Group
SN  - 2328-5982
UR  - https://doi.org/10.11648/j.earth.20241303.12
AB  - Remote sensing technology and X-rays fluorescence are largely used in the applied geology field. In this study, we combine field observations and petrography, remote sensing applications through the processing of the Landsat-8 OLI, and Ultra-violet fluorescence to map geological structures, hydrothermal alteration minerals, and characterize tungsten mineralization in the Djouzami area (Adamawa, Cameroon). Landsat-8 OLI satellite imagery, was processed to detect both hydrothermal alteration zones and regional structural lineaments associated with tungsten mineralization. Fieldworks and petrography revealed hydrothermal mineral assemblage made of muscovite, chlorite, tourmaline, hematite, calcite and sericite associated to metallic minerals including tungsten and pyrite hosted in quartz veins. This hydrothermal mineral assemblage is also identified in the gold-bearing quartz veins reported in several areas along the Lom group. Band Ratio (BR) and Principal component analysis (PCA) were implemented to extract spectral information related to alteration minerals. The Band Ratios 6/7, 4/2, and 6/5 have permits to map clay, iron oxide/hydroxides, and ferrous minerals, respectively. This study demonstrates the significant potential of fieldwork and multispectral remote sensing data processing for tungsten prospecting as a mineral exploration technique in the Djouzami region. The mapping led to the detection of 1334 lineaments which show four main directions. The ENE-WSW directions corresponds to the trending of the Sanaga shear zone; the NE-SW direction represents the trending of the Djouzami and the Bétaré-Oya shear zones or the main shear zone which underline the Lom group; the N-S and E-W directions are equivalent to the trending of the foliation in the Meiganga area. Most of the high hydrothermal zones and tungsten-bearing quartz veins are located along the NE-SW lineaments or shear zone. Gold-related NE-SW trending Djouzami shear zone is also proposed. The NE-SW structure constitute certainly pathway for mineralizing fluids and ground water circulation, and control tungsten mineralization. Results proposed in this work provide important information for research of characteristic hydrothermal minerals assemblage that accompany tungsten mineralization, and for identify structures that control this mineralization in the area.

VL  - 13
IS  - 3
ER  -
Department of Earth Sciences, Faculty of Science, University of Ngaoundere, Ngaoundere, Cameroon
Department of Earth Sciences, Faculty of Science, University of Yaounde I, Yaounde, Cameroon
Department of Earth Sciences, School of Higher Education, University of Maroua, Maroua, Cameroon
School of Geology and Mining Engineering, University of Ngaoundere, Meiganga, Cameroon
School of Geology and Mining Engineering, University of Ngaoundere, Meiganga, Cameroon
Department of Earth Sciences, Faculty of Science, University of Ngaoundere, Ngaoundere, Cameroon
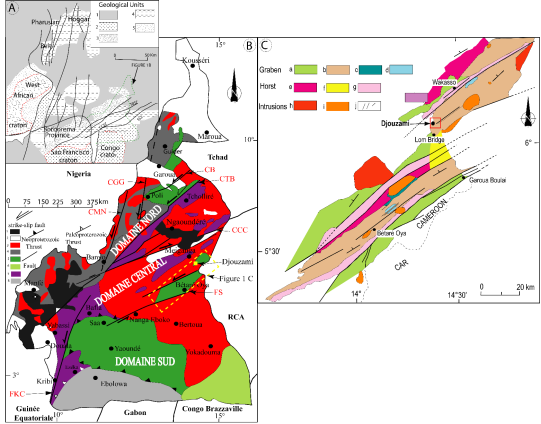
Figure 1. (A) Geology of West-central Africa and northern Brazil in a Gondwana (pre-drift) reconstruction (modified from [68, 71]. Thick line, boundary of the two continents: (1) Phanerozoic cover; (2) Neoproterozoic formations; (3) Regions of Brasiliano/Panafrican deformation in which Palaeoproterozoic basement is absent or only present as small isolated blocks; (4) Regions of Brasiliano/Panafrican deformation with large amounts of reworked Palaeoproterozoic basement; (5) cratons. (B) Geological map of Cameroon (after [68]. The Lom group is represented by a yellow rectangle. KCF (Kribi-Campo fault); SSZ (Sanaga shear zone); CCSZ (Central Cameroon shear zone); TBSZ (Tcholliré-Banyo shear zone); MNSZ (Mayo Nolti shear zone) and GGSZ (Godé-Gormaya shear zone). (1) volcanic rokcs (Tertiary to recent); (2) Post-Panafrican sedimentary cover; (3) Syn- to Post-tectonic granitoids (500-600Ma); (4) Pre- to syn-tectonic orthogneisses (600-660Ma); (5) Meso- to Neoproterozoic volcano-sedimentary belt (700-1000Ma; (6) Yokadouma and Dja series (age unknown); (7) Palaeoproterozoic gneiss and orthogneiss (2100Ma) and (8) Ntem Complex (3000Ma). (C) Structural map of the Lom Group [72]. Monocyclic units associated to grabens: (a) orthogneiss; (b) Lom volcaniclastic series; (c) polygenic conglomerates; (d) Mari quartzites. Polycyclic units: (e) staurolite micaschists; (f) Lom bridge gneisses; (g) staurolite and chloritoid ductile mylonites. Intrusions with uncertain structural position: (h) granites (G2); (i) granites and monzonites; (j) metalamprophyres (modified after [47]). Inset: location of the Lom Group as an extensional relay zone between two en- echelon segments of the Sanaga fault; the opening of this basin corresponds to sinistral shear movement along these major faults. The study area is indicated in Figure 1C by the red rectangle.
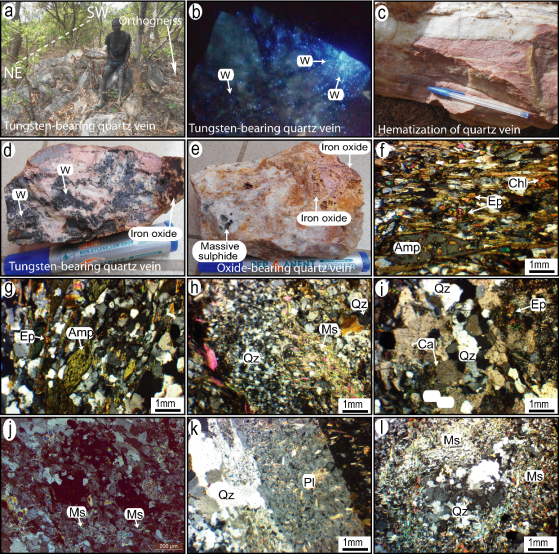
Figure 2. Photography and microphotography of the rocks from Djouzami. (a) tungsten-bearing quartz vein with NE-SW trends, cross-cutting orthogneiss; (b) Blue fluorescence of tungsten (scheelite) in the quartz vein sample; (c) Hematization of quartz vein; (d) Tungsten (scheelite)-iron oxide association in the quartz vein sample; (e) Massive sulphide-iron oxide association in the quartz vein sample; (f, g) Epidote and chlorite Hydrothermal in amphibolite; (h, i) Muscovite-epidote-calcite Hydrothermal in orthogneiss; (j) Muscovitization in mylonitic gneiss; (k) Sericitization in metagranite; (l) Muscovitization in metagranite.
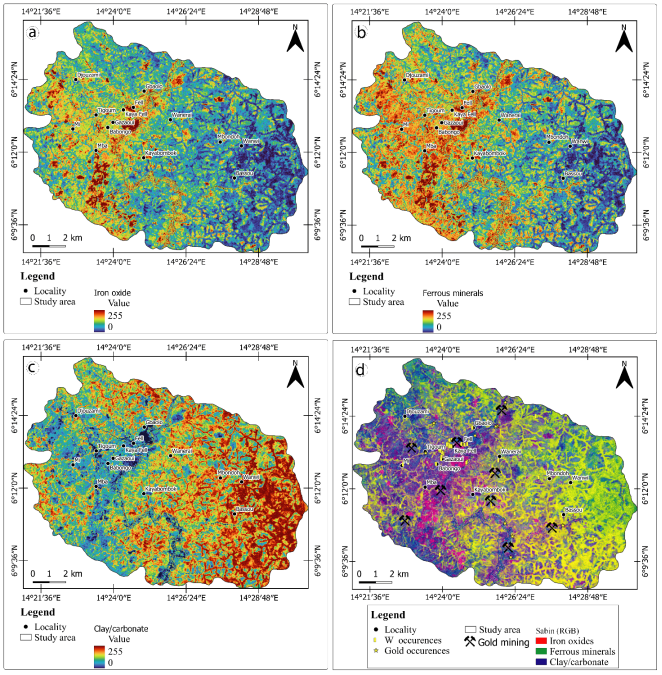
Figure 3. Map of the hydrothermal alteration zones from the Djouzami (extract from the Landsat 8 image). (a) Map showing areas of abundance of iron oxides; (b) Map showing areas of abundance of ferrous minerals; (c) Map showing areas of abundance of clay and carbonate minerals; (d) Map from the Sabin 1999 report showing zones of hydrothermal alteration.
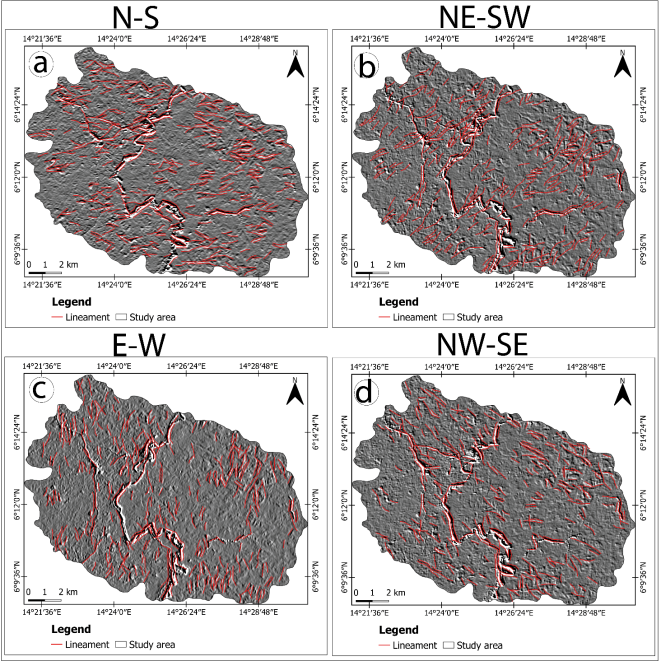
Figure 4. Sobel directional filter map of Djouzami lineaments (extracted from Landsat 8, ACP1 image). (a) Directional Sobel filter map of N-S lineaments; (b) Directional Sobel filter map of NE-SW lineaments; (c) Directional Sobel filter map of E-W lineaments; (d) Directional Sobel filter map of NW-SE lineaments.
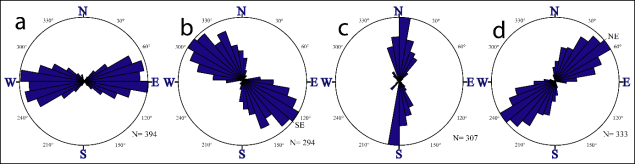
Figure 5. Rose direction diagram of Djouzami Sobel directional filter lineaments. (a) Rose diagram of N-S lineaments; (b) Rose lineament diagram; (c) Rose diagram of E-W lineaments; (d) Rose diagram of NW-SE lineaments.
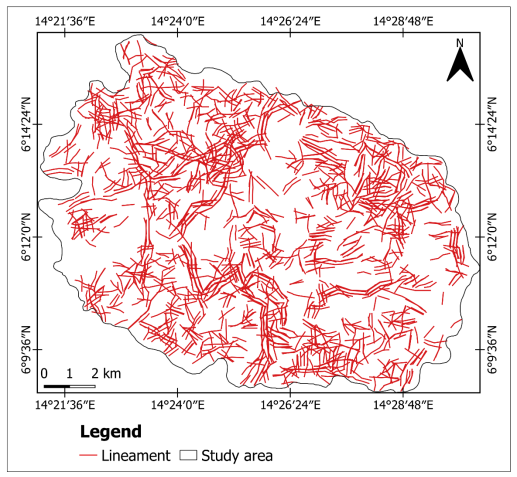
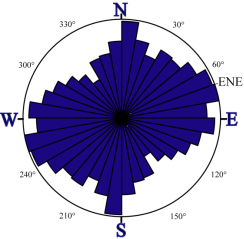
Figure 7. Rose summary diagram of the direction of Djouzami lineaments.